Macro Analysis
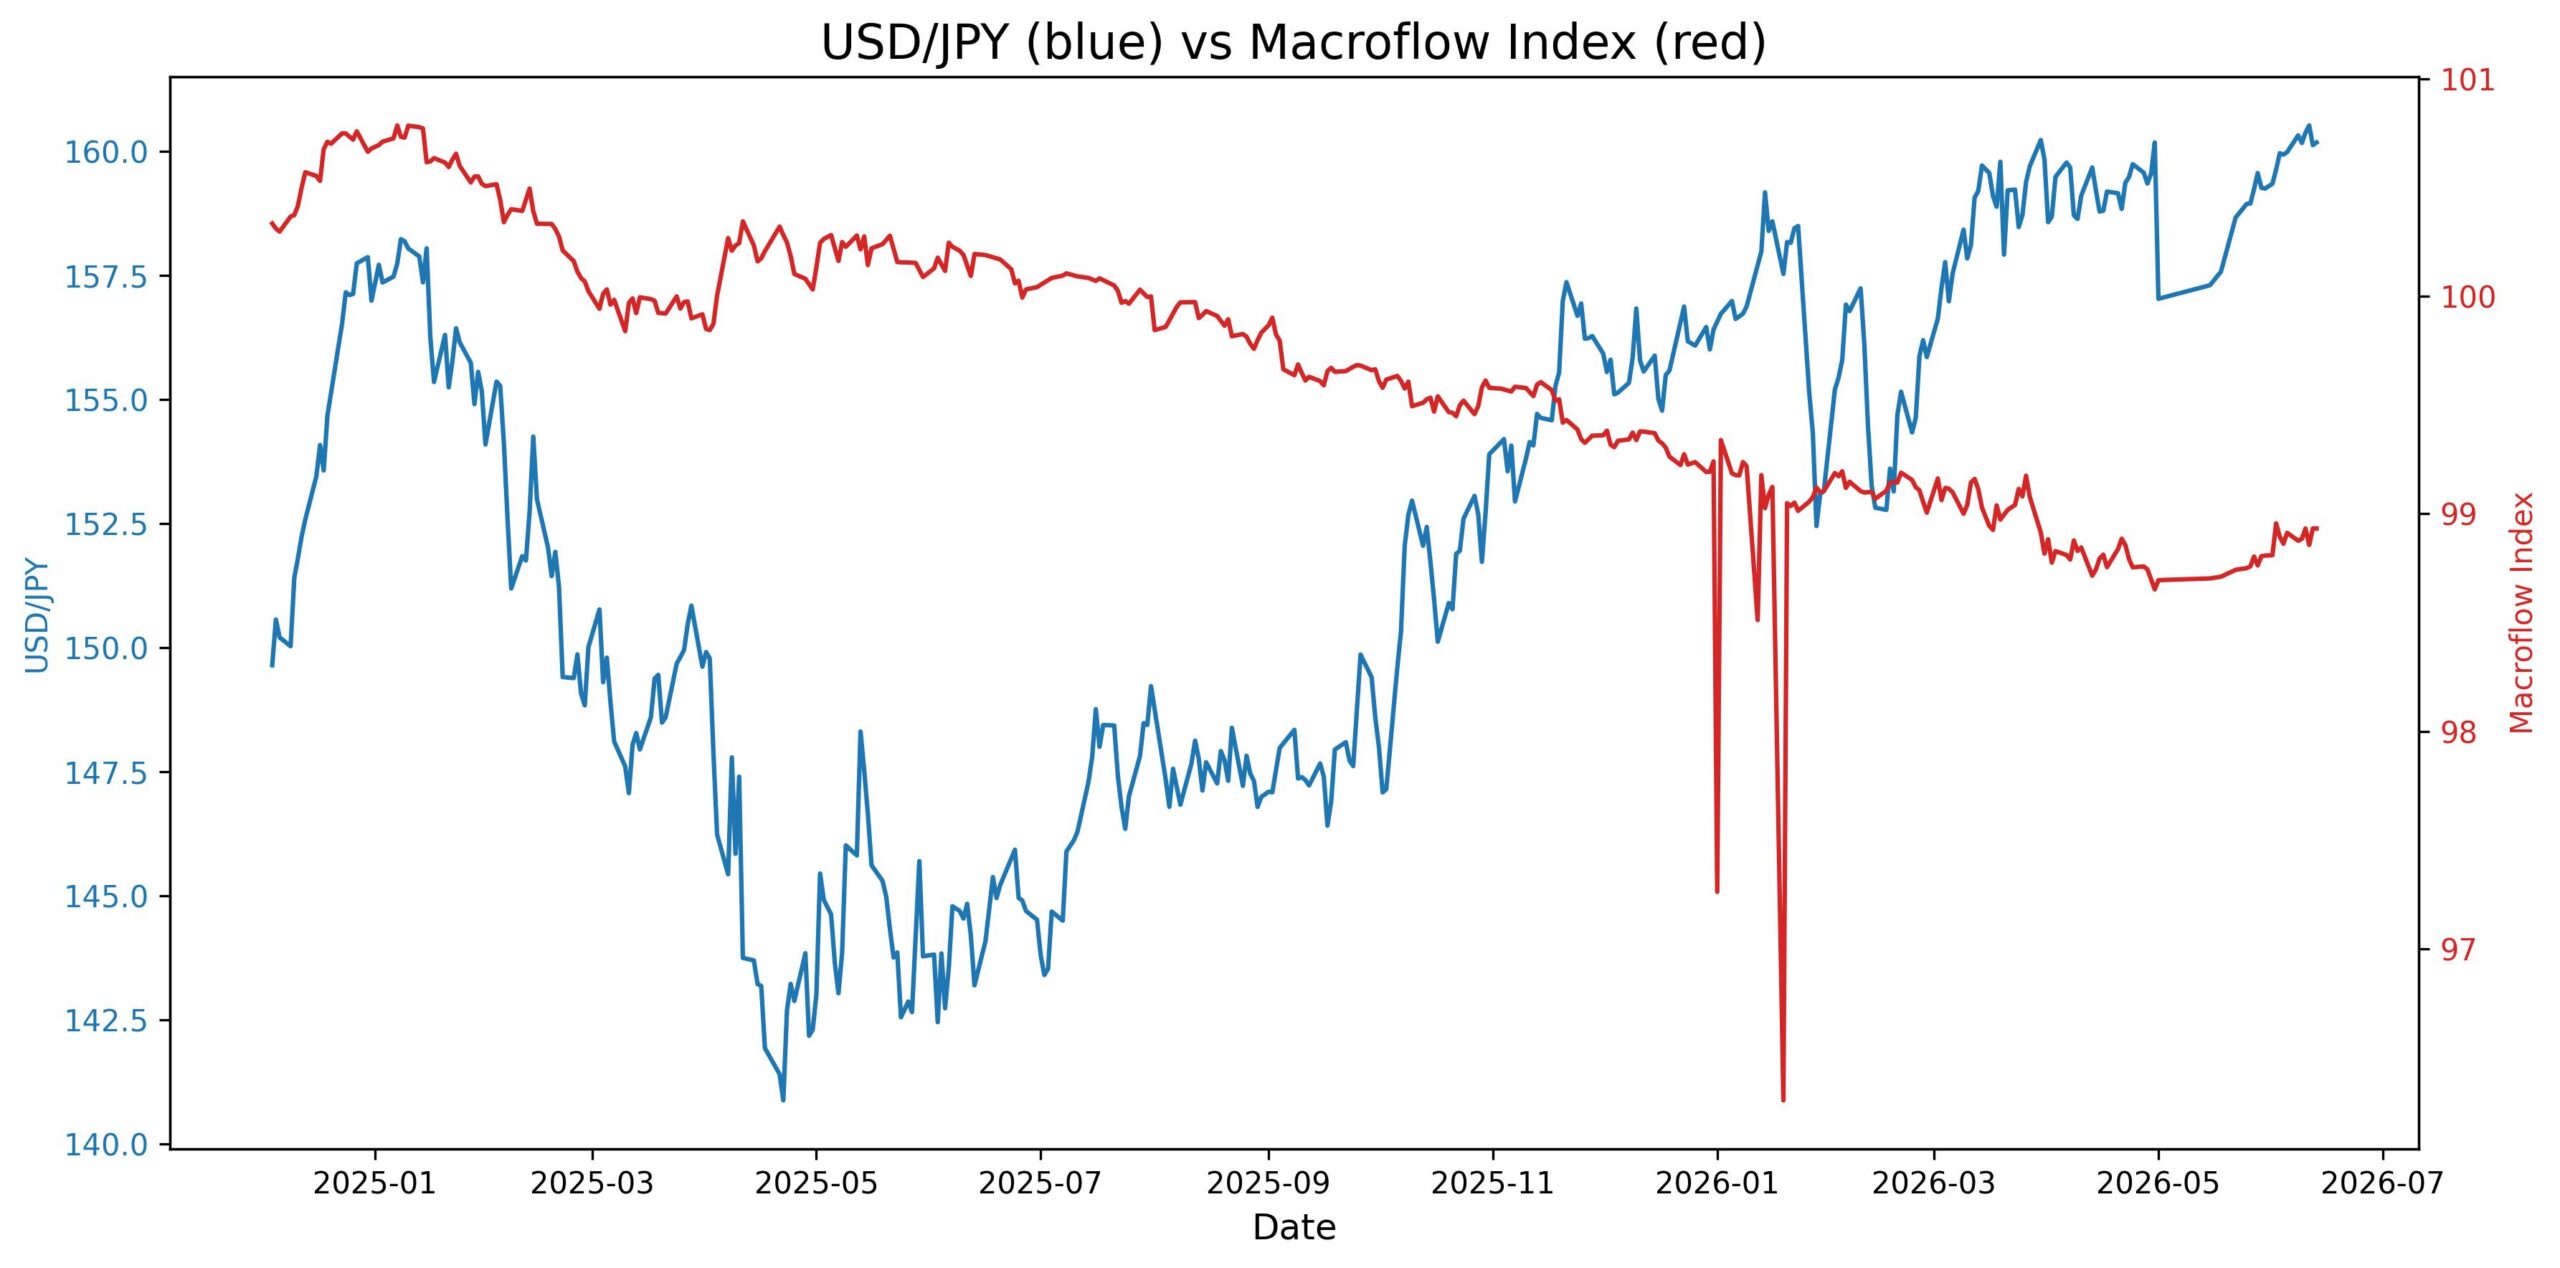
From late May to mid-June, USD/JPY trades in a tight range near 159–160.5, with a recent high of 160.527 on June 11. The Macroflow Index hovers around 98.86–98.93, showing little net change despite USD/JPY’s slight upswing.
**Correlation and Divergence**
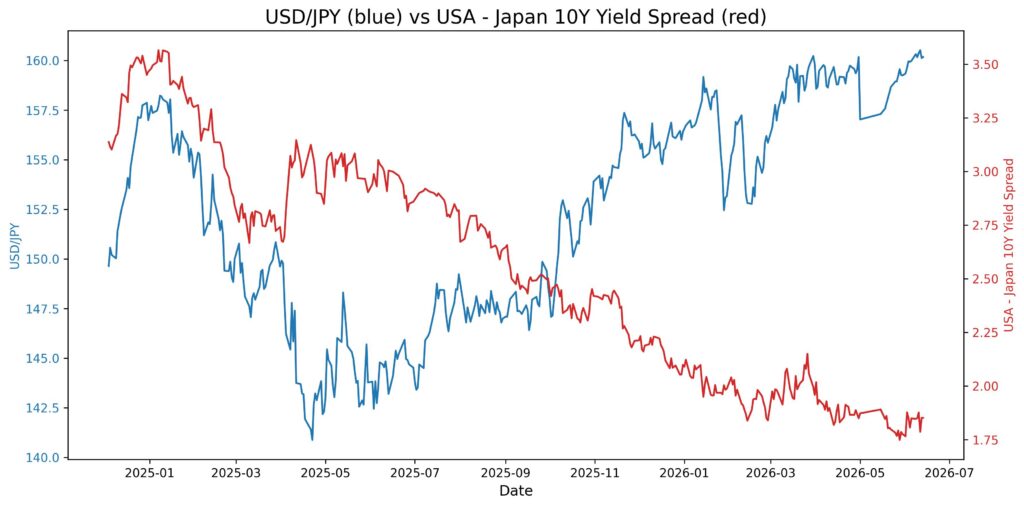
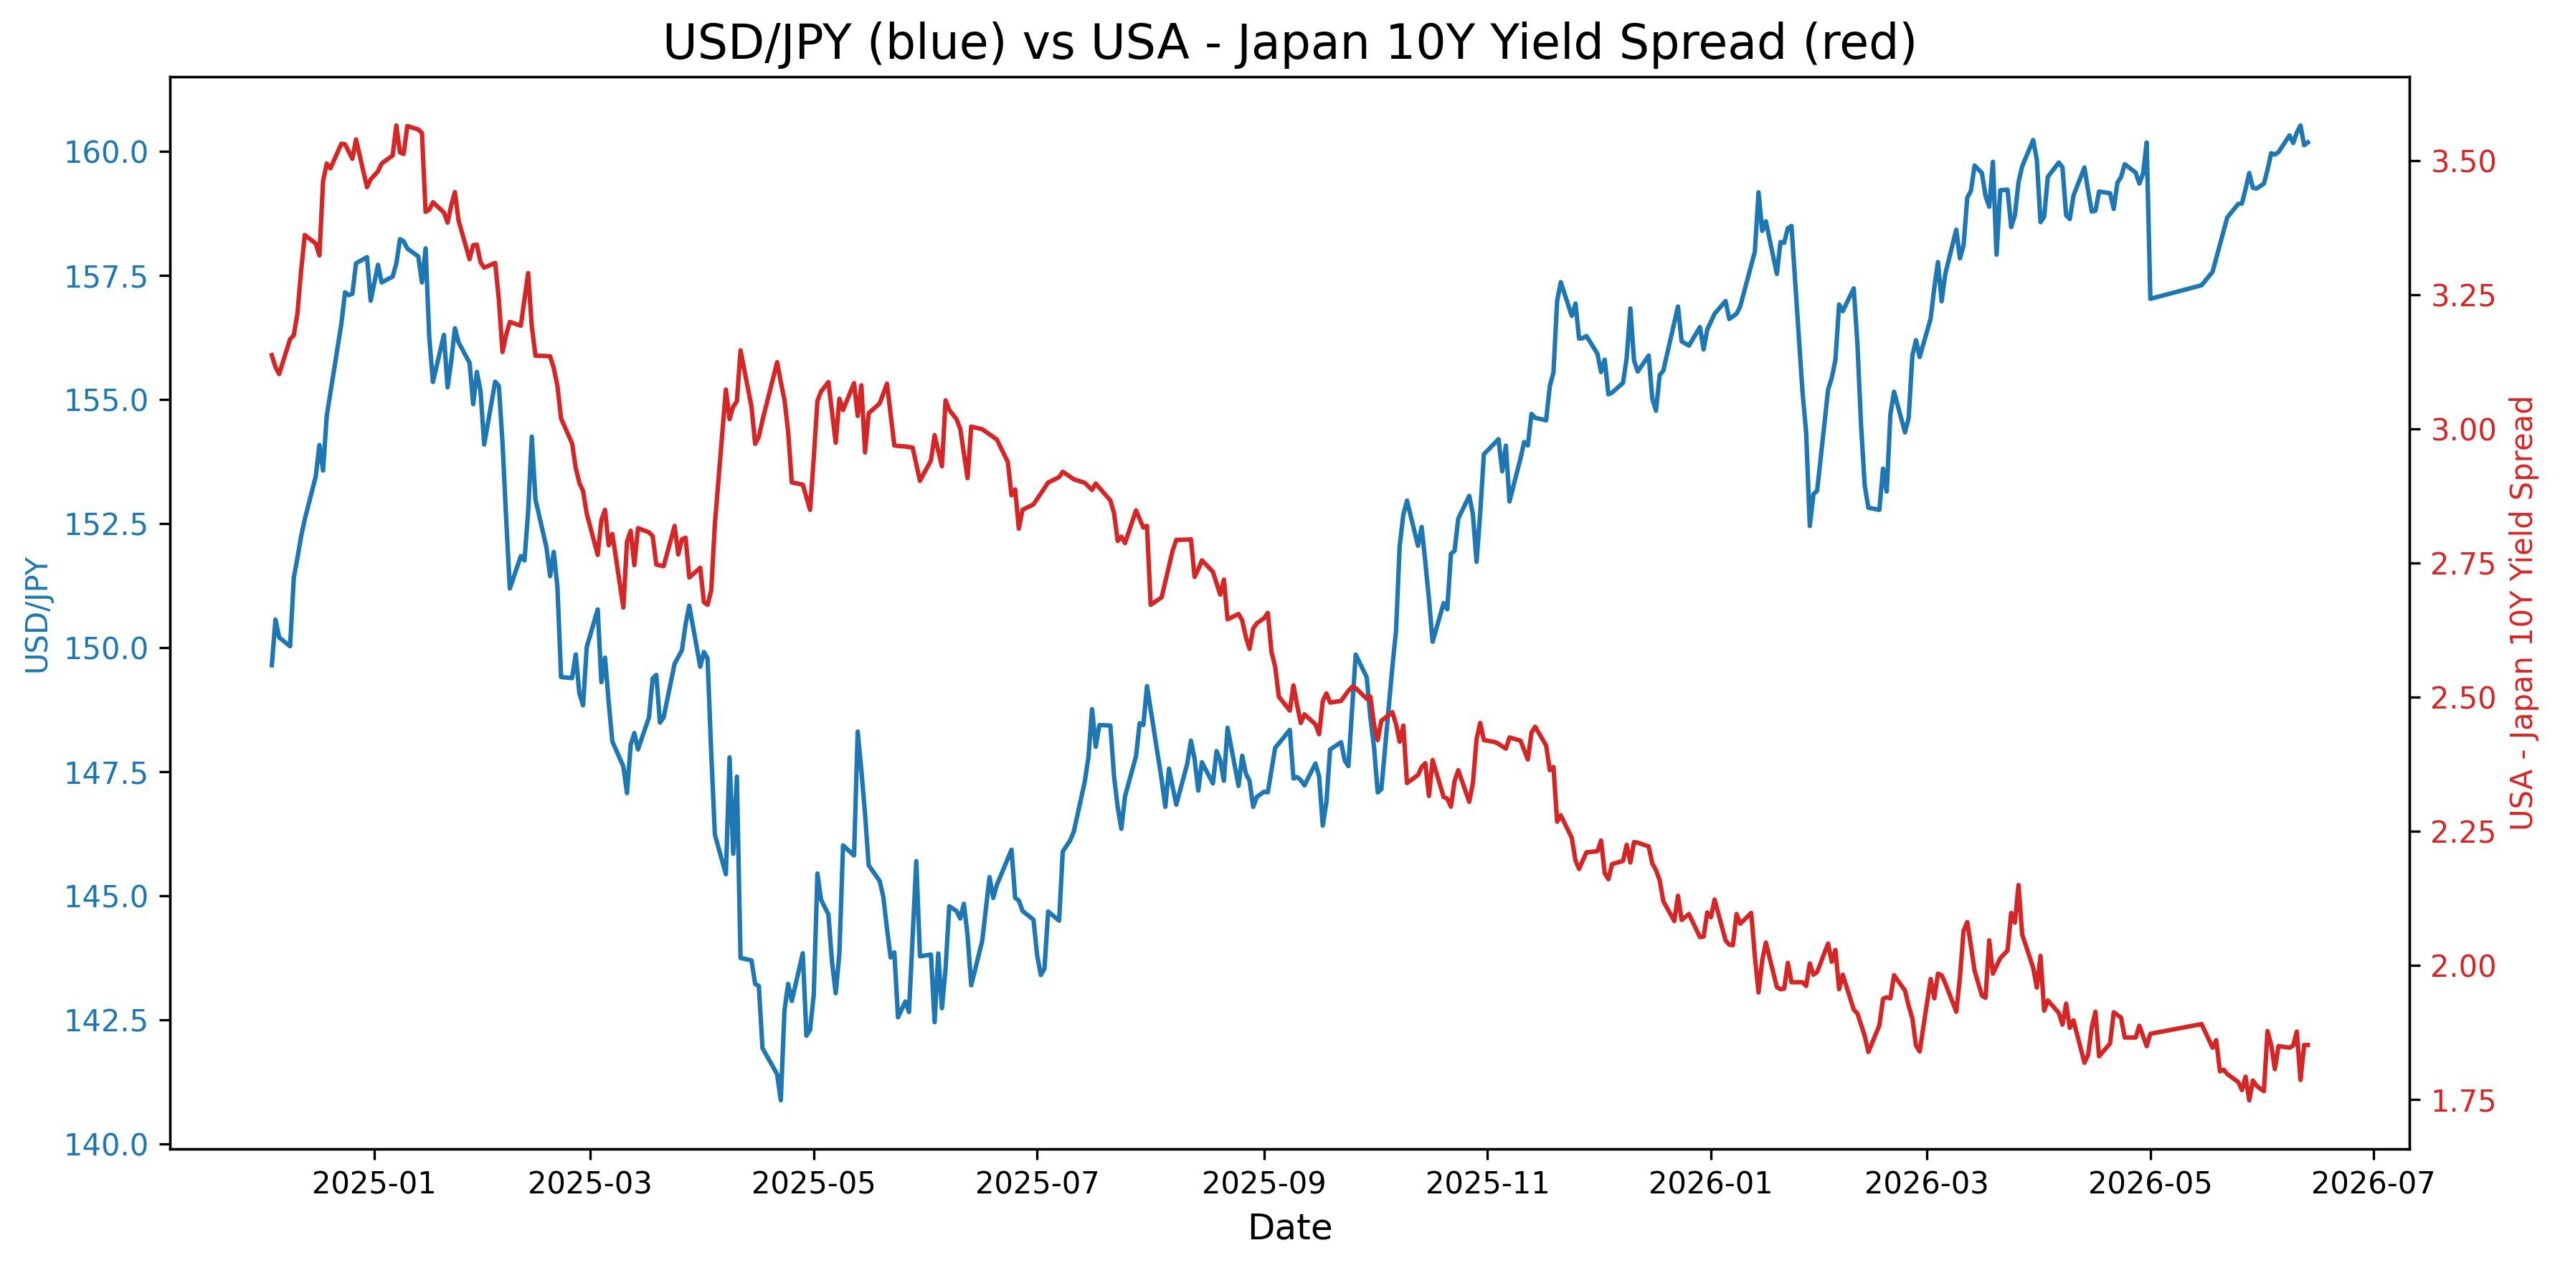
The historical correlation between USD/JPY and the Macroflow Index is only 0.32, so the pair and the index do not move in lockstep. Recently, we see a short-term divergence: on June 11 USD/JPY printed a new high while the Index dropped to 98.857 (from 98.933 the prior day). The Index then recovered to 98.933 on June 12–13, while USD/JPY eased to 160.13–160.19. This suggests the index’s decline (driven by a narrower U.S.–Japan yield spread or a rise in Brent crude) did not pull USD/JPY down as strongly, hinting at other forces supporting the pair—likely safe‑haven demand or positioning ahead of central bank meetings.
**Macro Factors at Play**
Two high‑impact events arrive in the coming week:
– **BOJ Policy Rate (June 16):** Markets expect a hike from below 0.75% to below 1.00%. A hawkish move would typically weaken USD/JPY (strengthen JPY). However, the pair has held up near 160, implying either the hike is already priced in or traders focus on the US side.
– **FOMC Decision (June 17):** The Fed is expected to keep rates at 3.75%. Any dovish surprise (e.g., lower projections) could cap USD gains, while a hawkish hold could extend the recent range. The combination of a BOJ hike and steady Fed rates may create a bearish bias for USD/JPY, but actual price action will depend on guidance and press conferences.
**Technical Snapshot**
On the daily chart, USD/JPY respects support near 159.00 (validated by multiple touches in late May and early June) and resistance at 160.50–161.00. The pair lacks clear directional momentum; it oscillates within this 150‑pip band. A break above 160.55 (recent high) could open a run toward 162, while a drop below 159.00 would target the 157.80 area (May low). Expect increased volatility around the BOJ and FOMC decisions, likely breaking the range in one direction.
COT Analysis
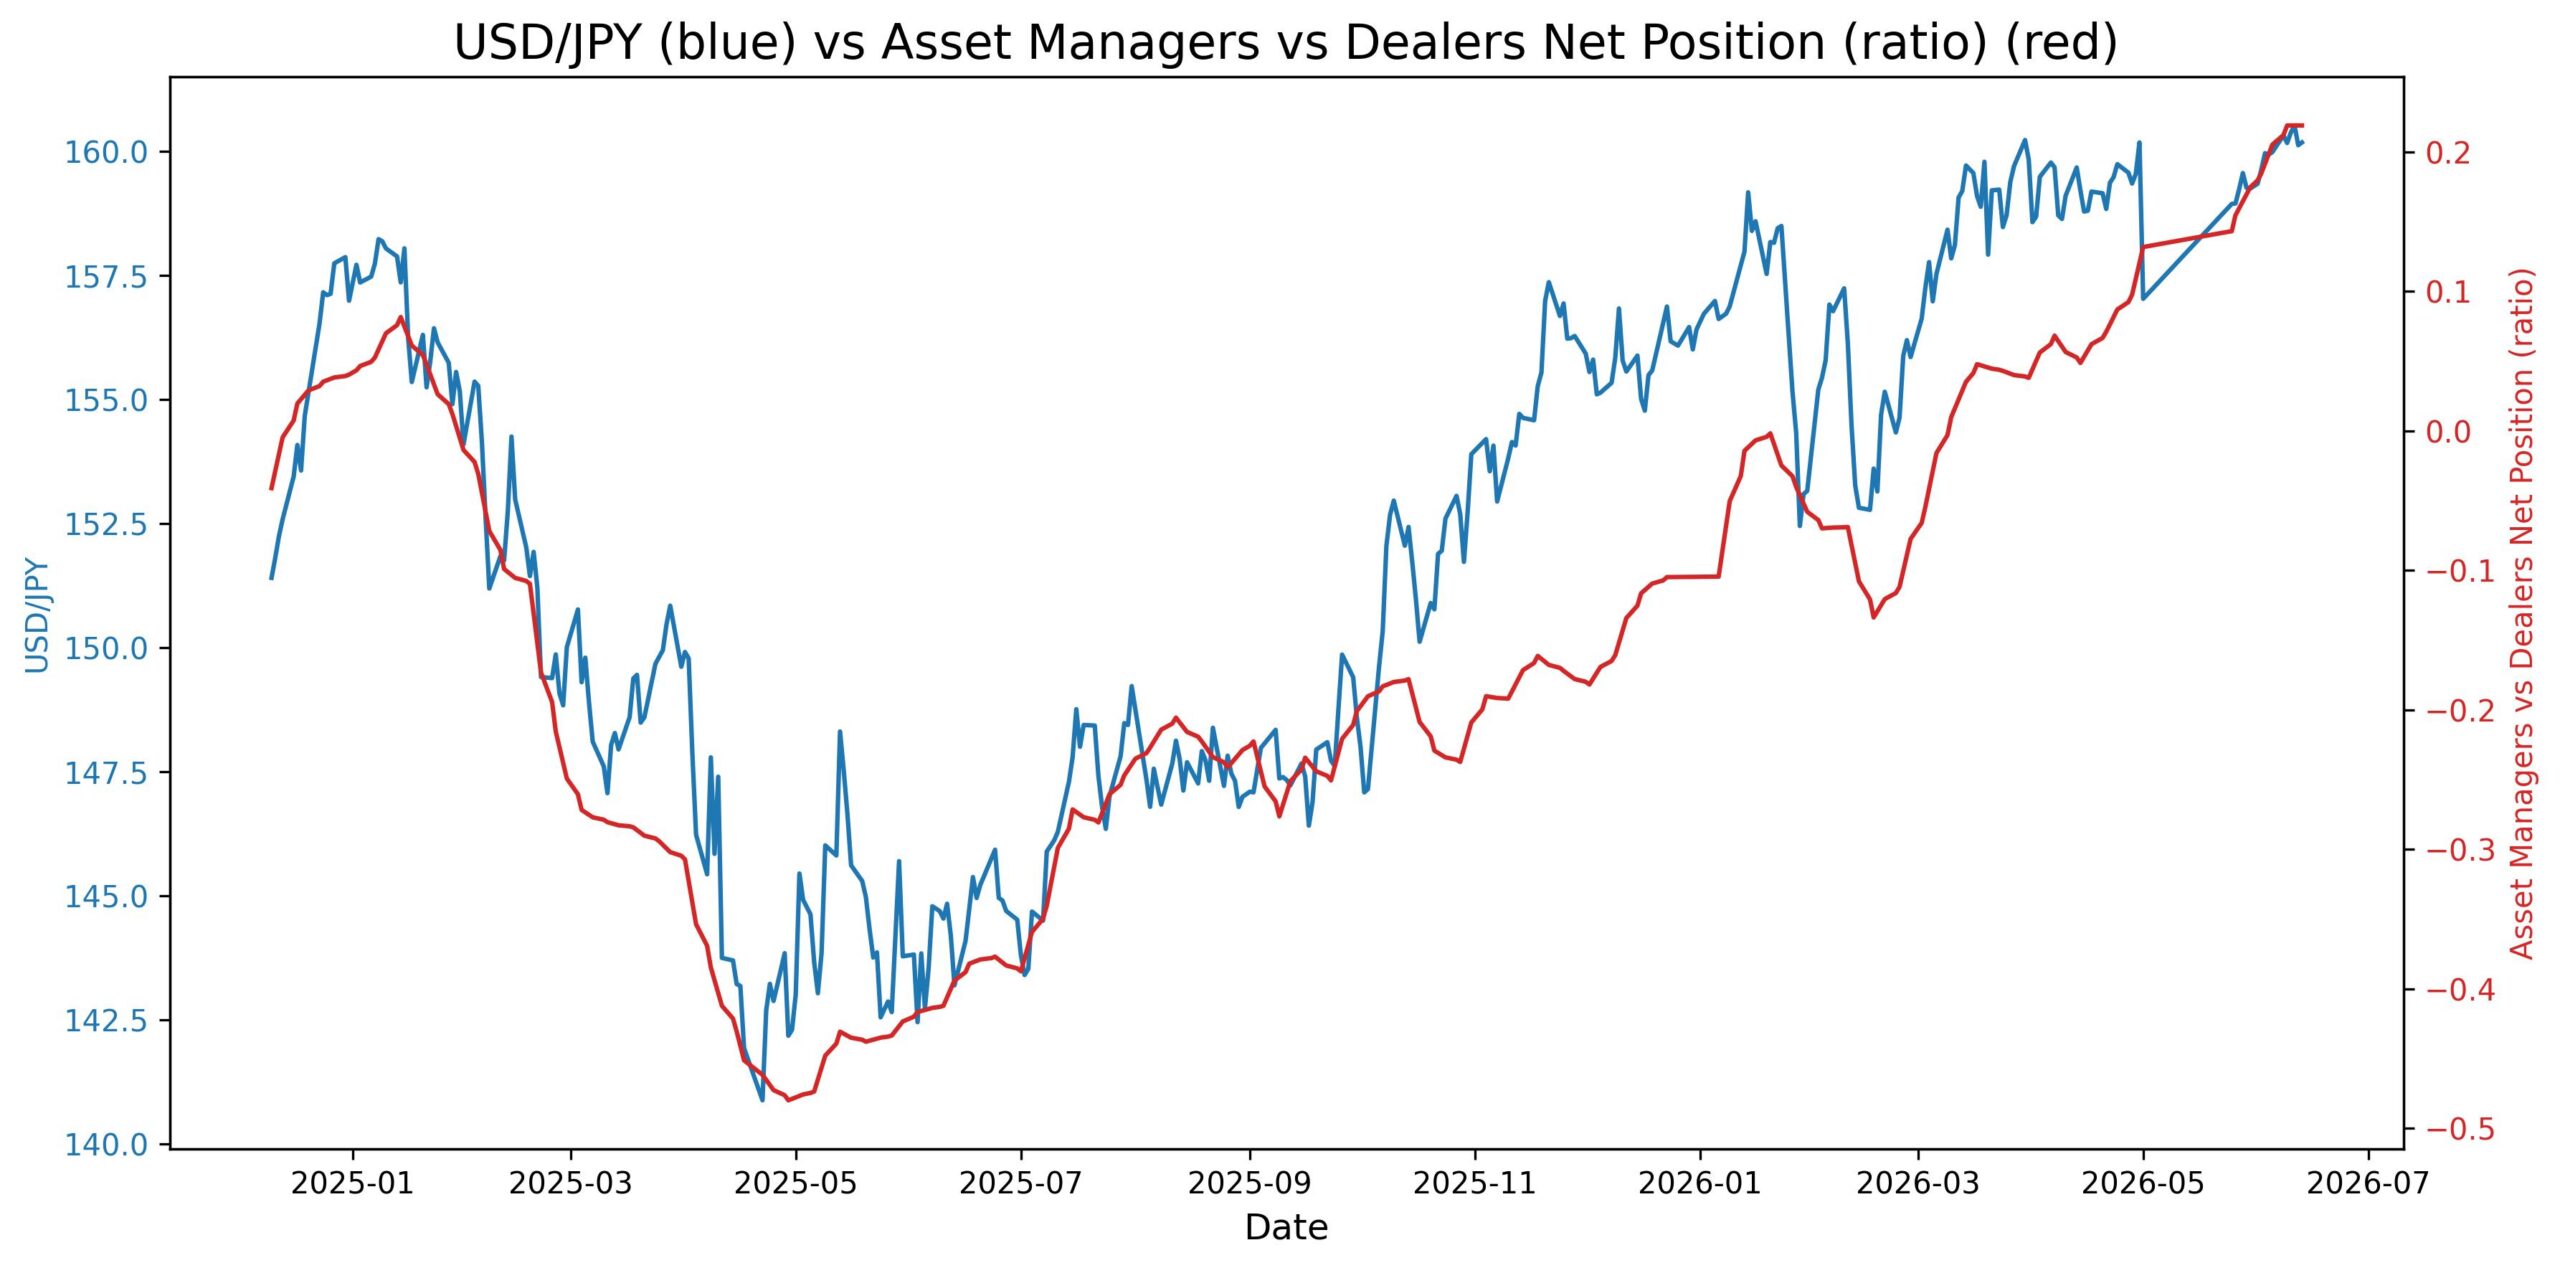
USD/JPY price and the large trader net long ratio show a strong convergence from early 2026, with both trending higher. In the last two weeks, the ratio has plateaued near 1.17 while the price consolidates around 160, creating a divergence. This divergence indicates a potential loss of bullish momentum as sentiment stalls.
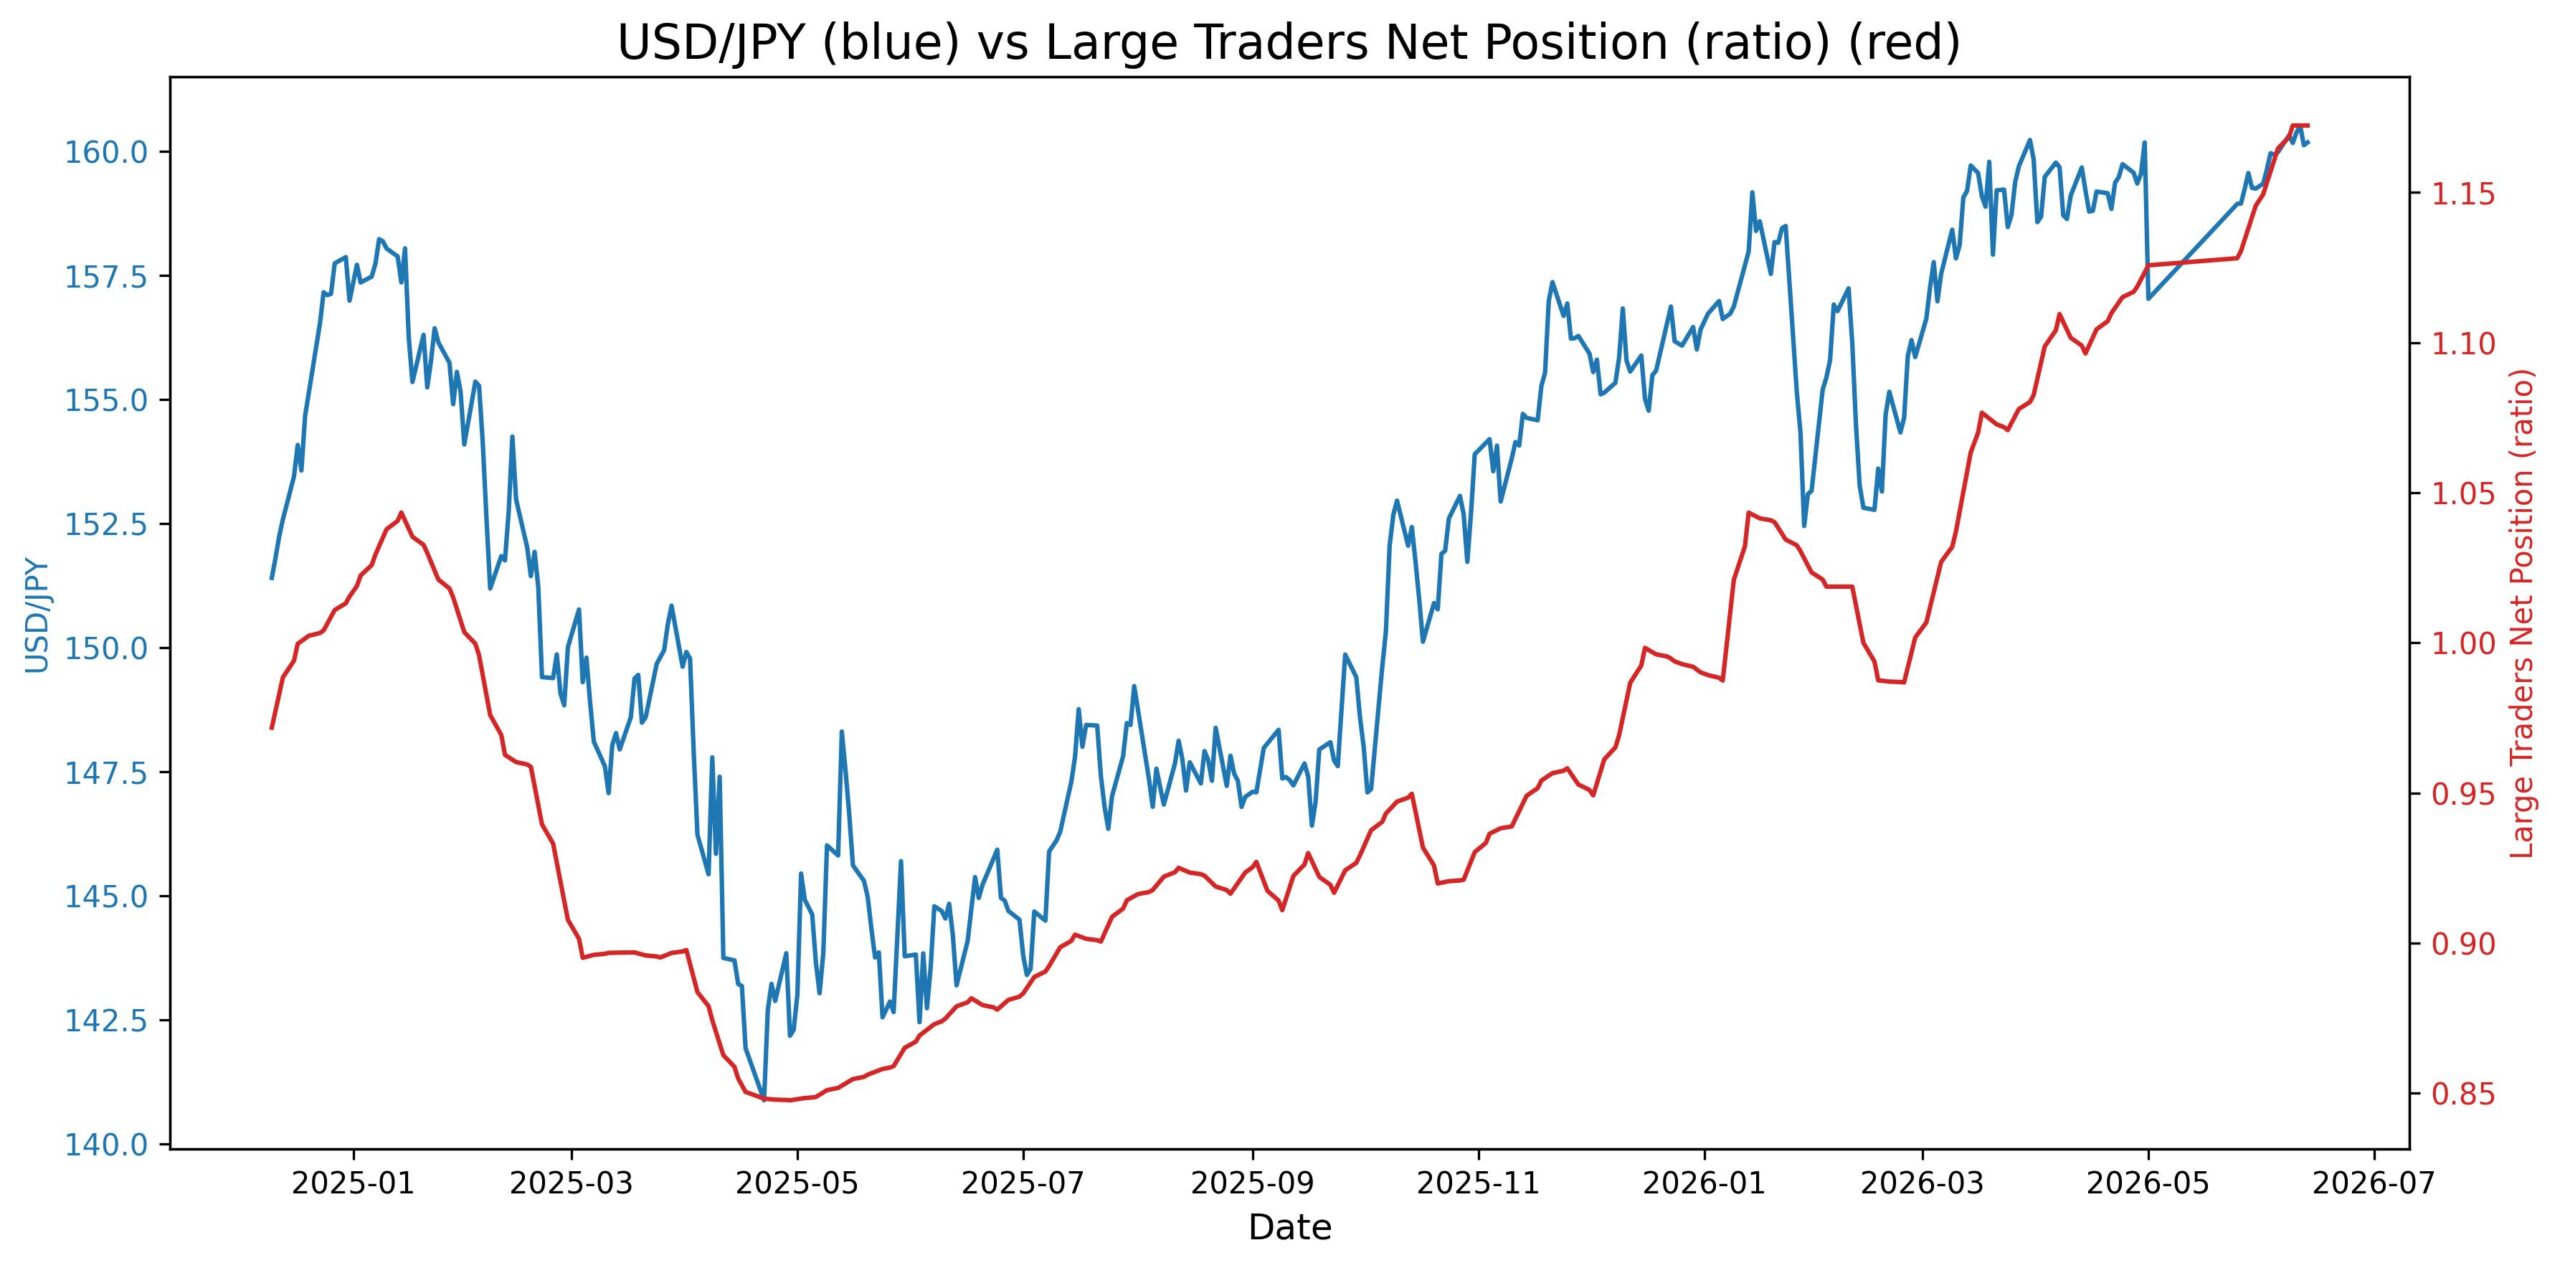
The recent daily data reveals a bearish divergence: USD/JPY price action shows choppy trading and failed new highs around 160.50, while the Asset Managers Net Position ratio continues to climb to fresh highs. This suggests that despite strong bullish sentiment from institutional traders, the pair struggles to gain upward traction, which often warns of a potential trend reversal or at least a stall. For daily and weekly traders, this divergence signals that the current rally lacks strong price confirmation, so key support near 158.00 and resistance at 160.50 become critical levels to watch for a breakout or breakdown.
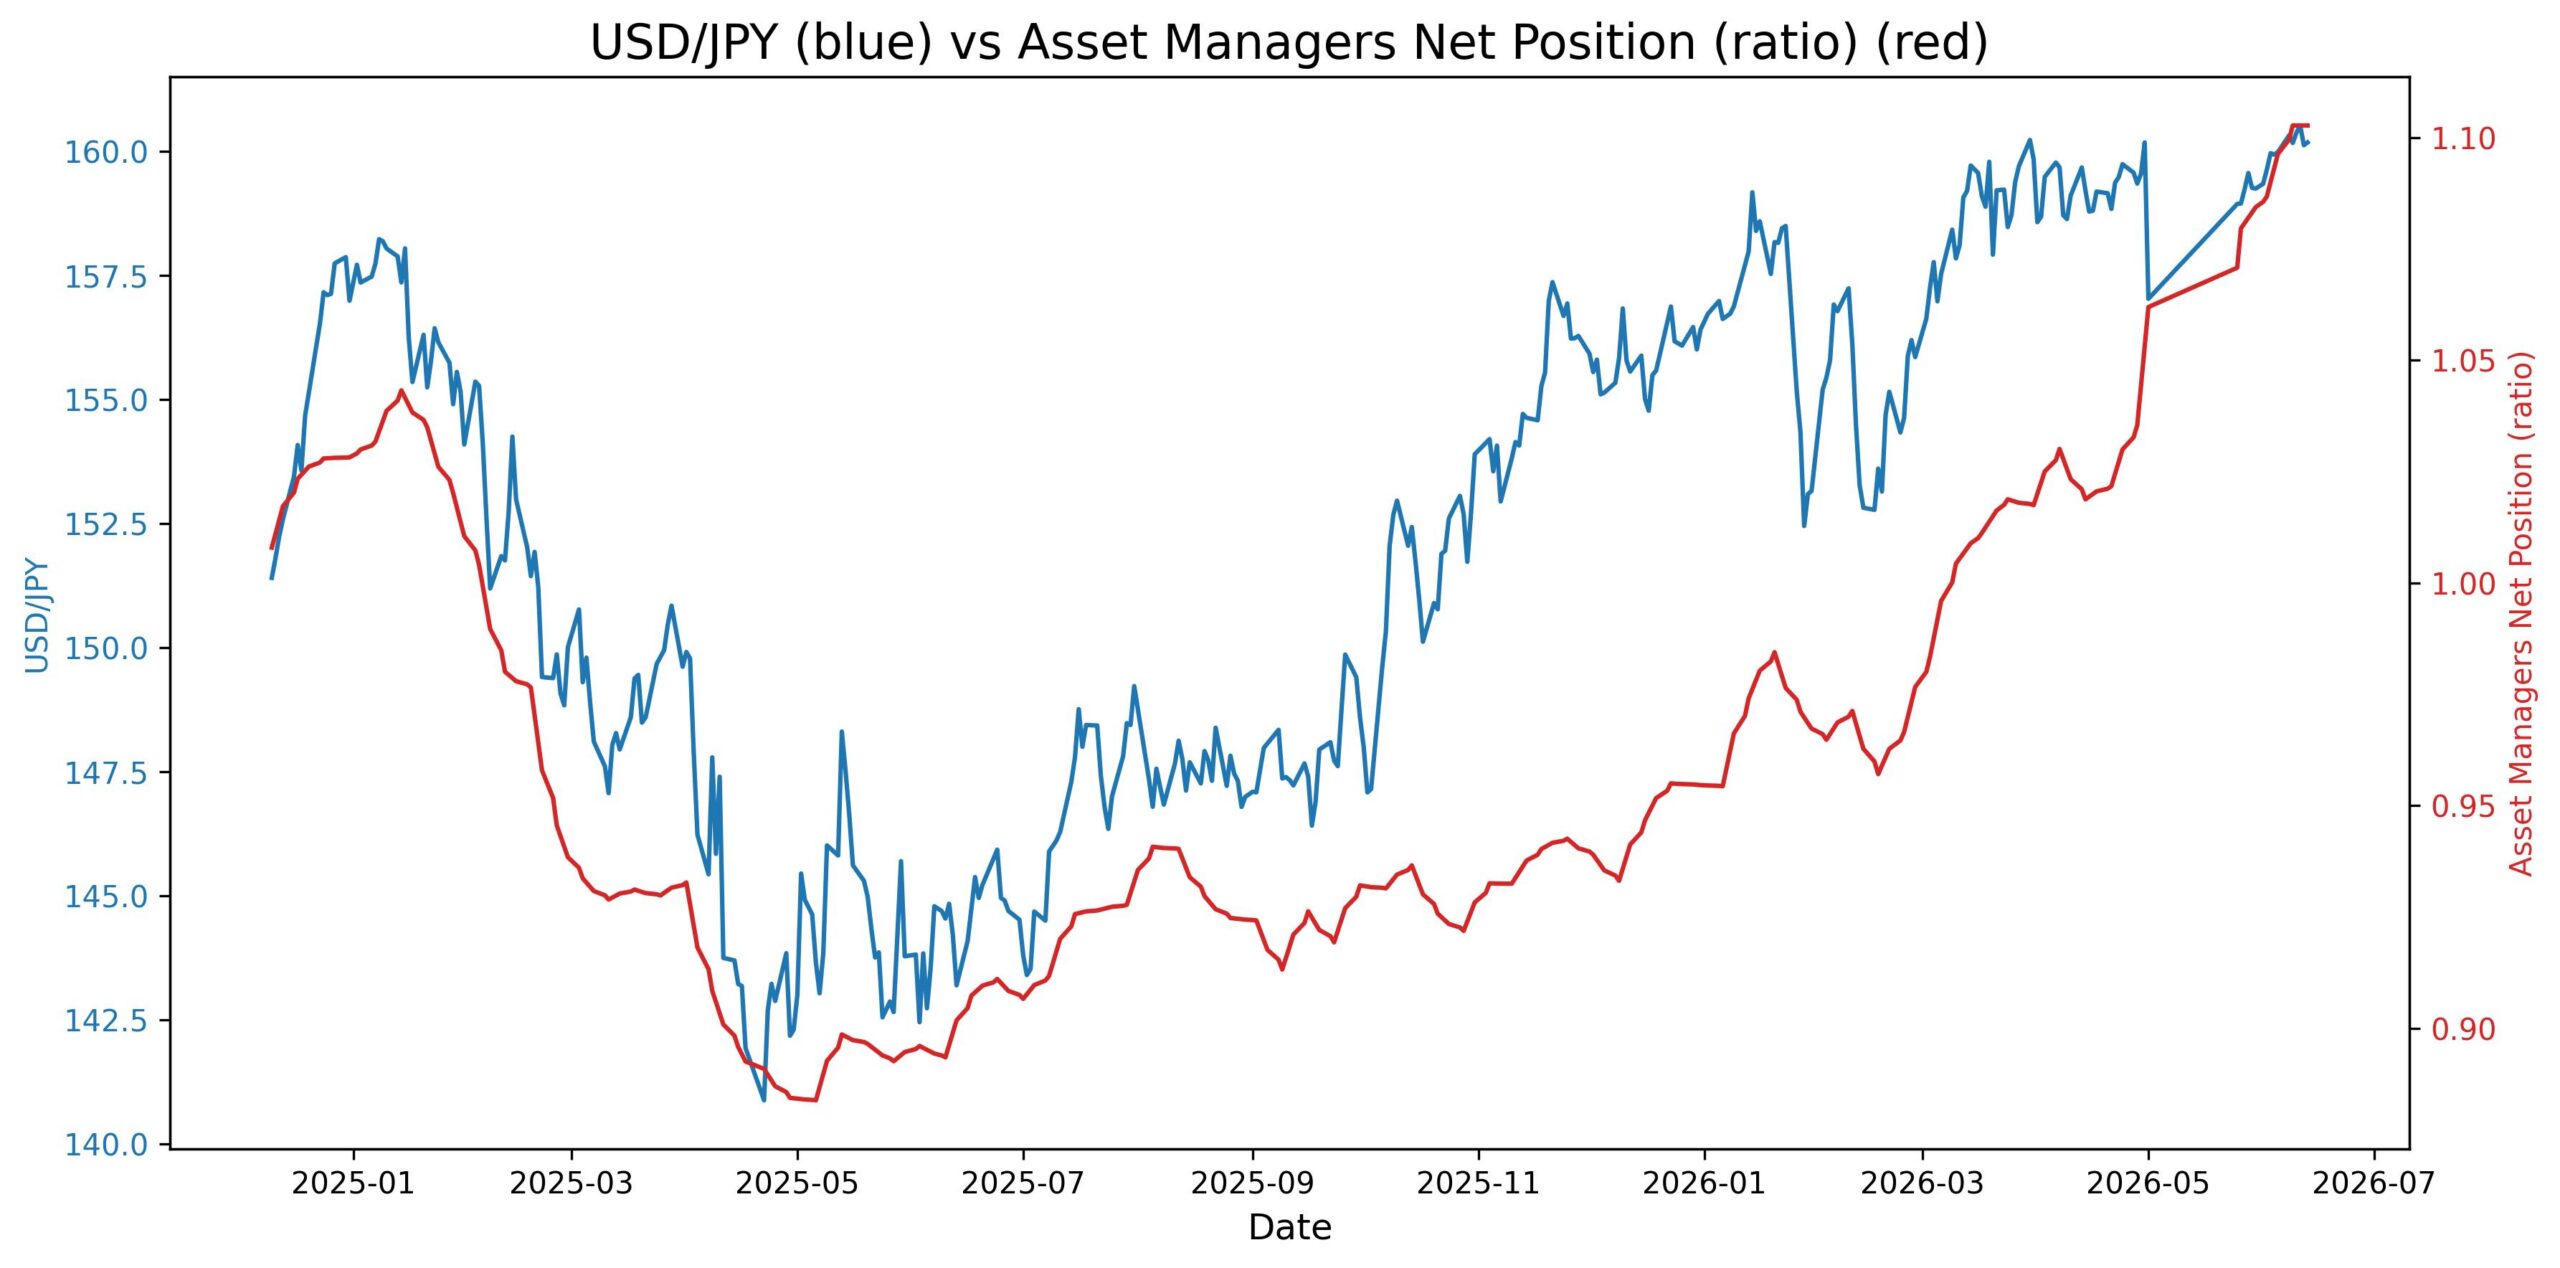
USD/JPY has rallied from lows near 140 to the 160 area since early 2026, while the Asset Manager vs Dealer spread turned from negative to positive and climbed higher, confirming bullish sentiment. In recent weeks, price consolidation near 160 has coincided with a flat spread, signaling a loss of bullish momentum and possible divergence. This plateau warrants close attention on daily and weekly charts for signs of a trend change.