Macro Analysis
EUR/USD Daily Analysis: Relationship with MacroFlow Index
Price Action (Daily & Weekly View)
EUR/USD has moved in a strong uptrend from December 2024 lows near 1.025 to highs above 1.20 in January 2026. Over the past few months, the pair pulled back from the 1.20 area and now trades around 1.145–1.16. The daily chart shows a clear resistance level near 1.18 and support around 1.14.
MacroFlow Index (MFI) Alignment
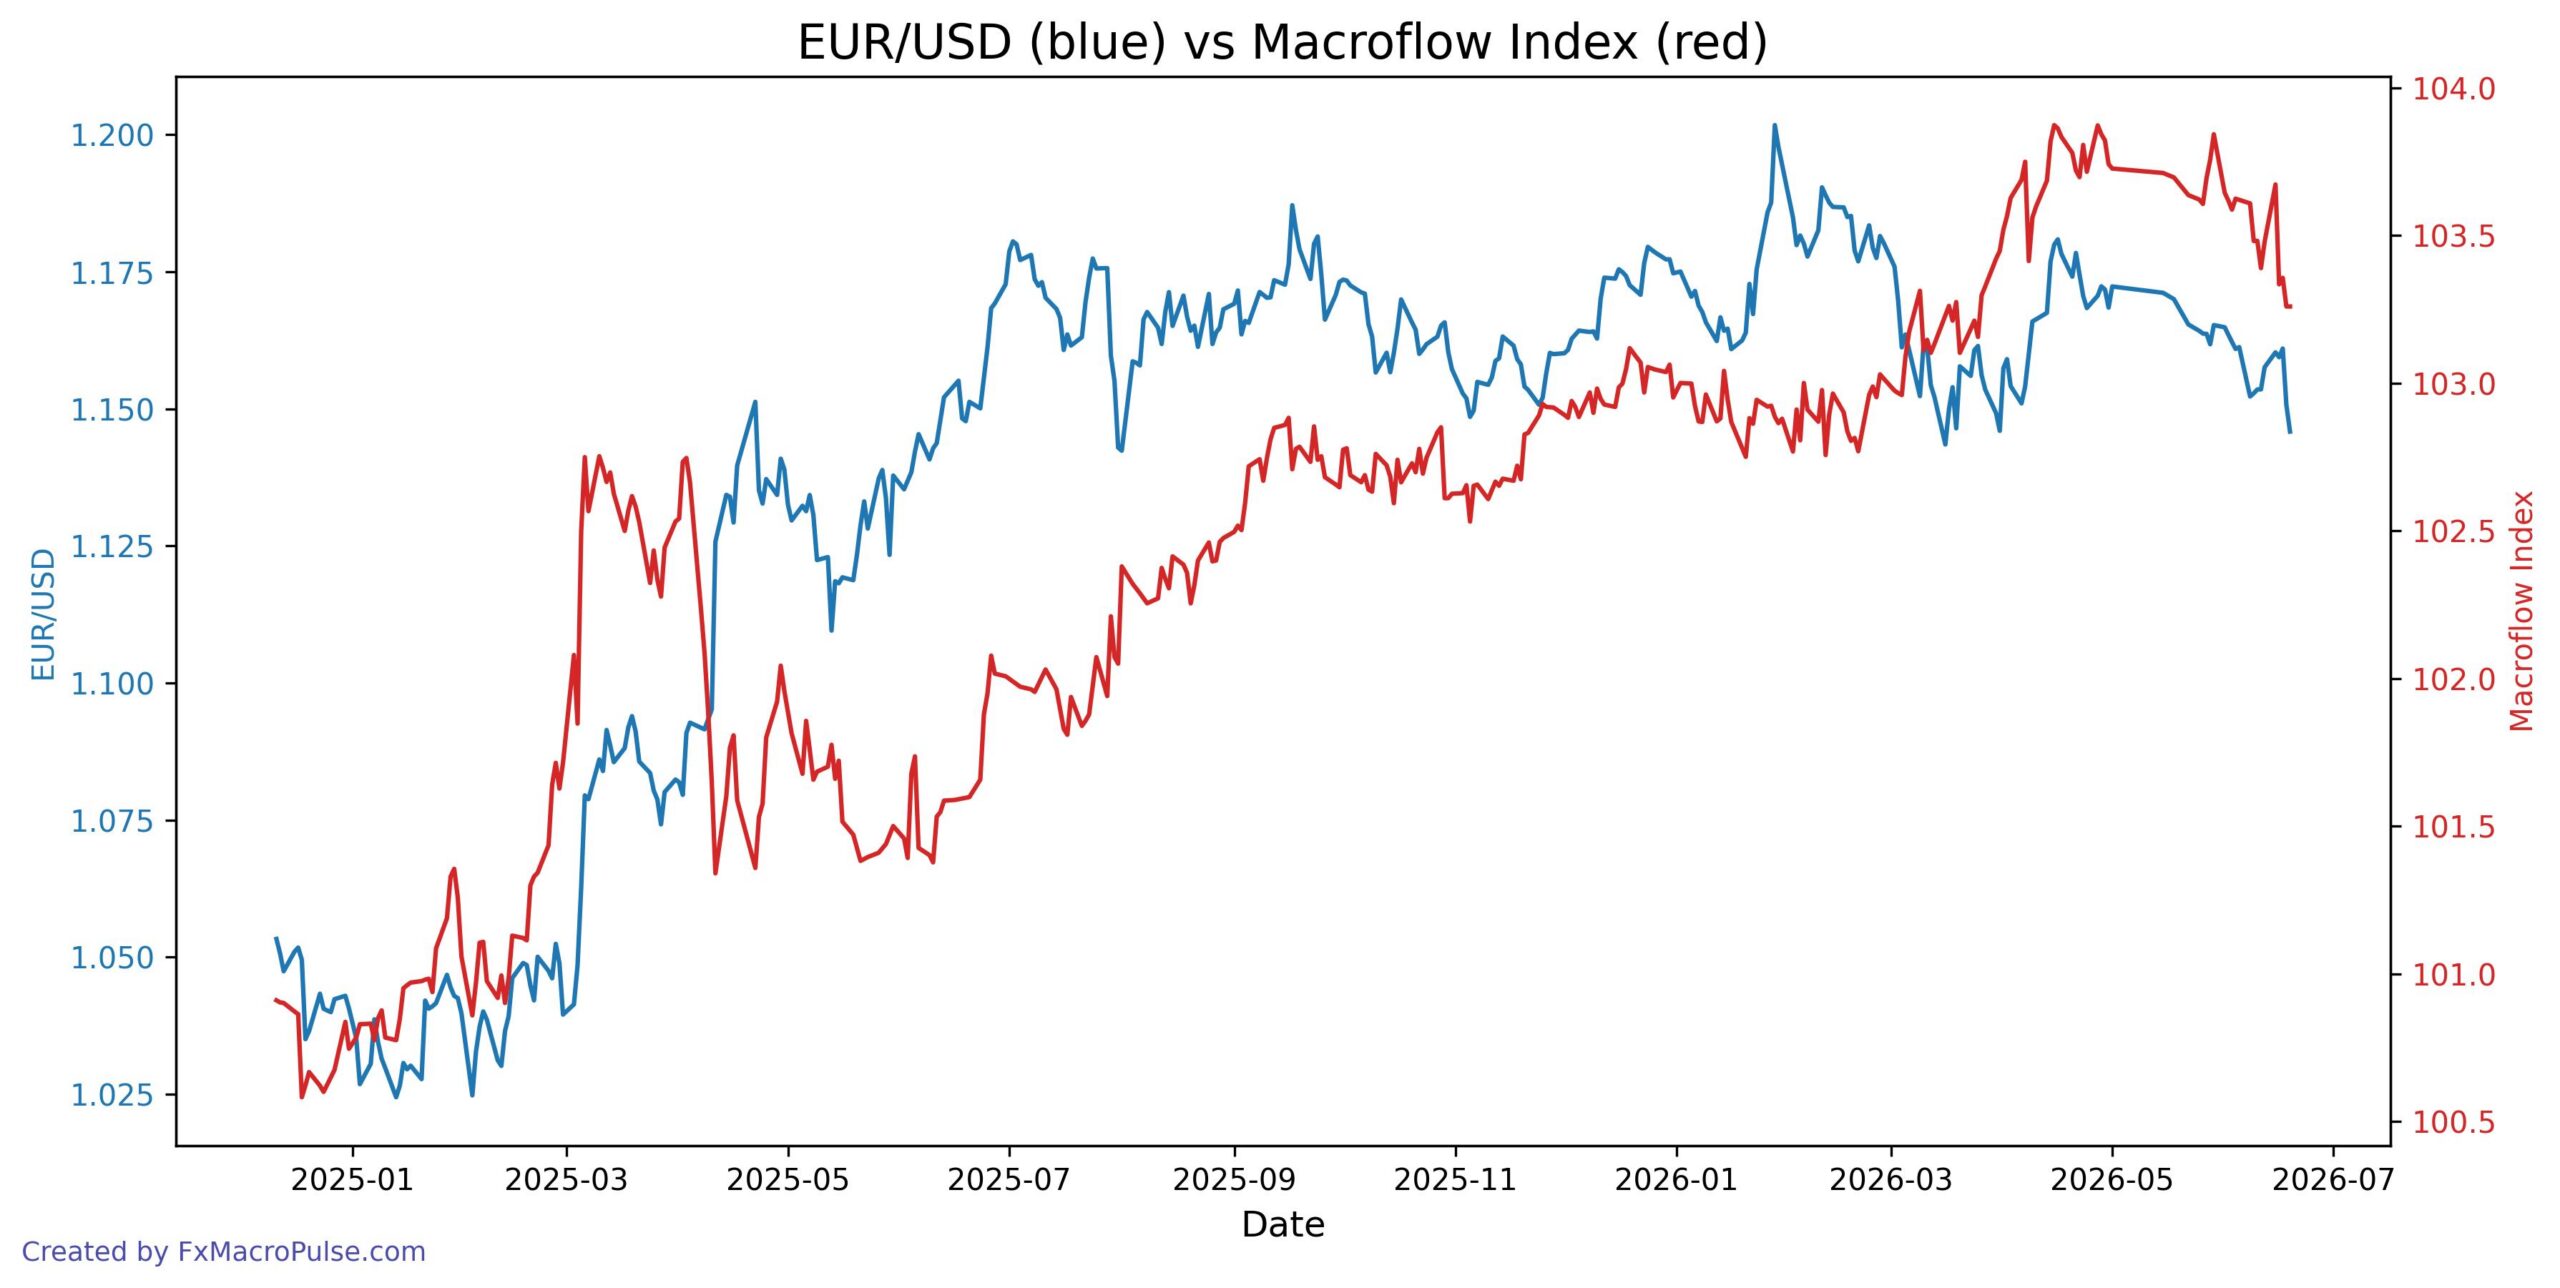
The MFI (built from yield spread and gold) also trended higher from 100.9 to above 103.8, then eased to the low 103s. Over the entire dataset, the pair and MFI move together with a historical correlation of 0.53. In recent weeks (June 2026), both EUR/USD and MFI declined simultaneously from mid-month highs – no divergence. For example, from June 17 to June 19, EUR/USD fell from 1.161 to 1.1458, while MFI dropped from 103.36 to 103.26. This convergence confirms the positive correlation remains intact.
Key Macro Drivers
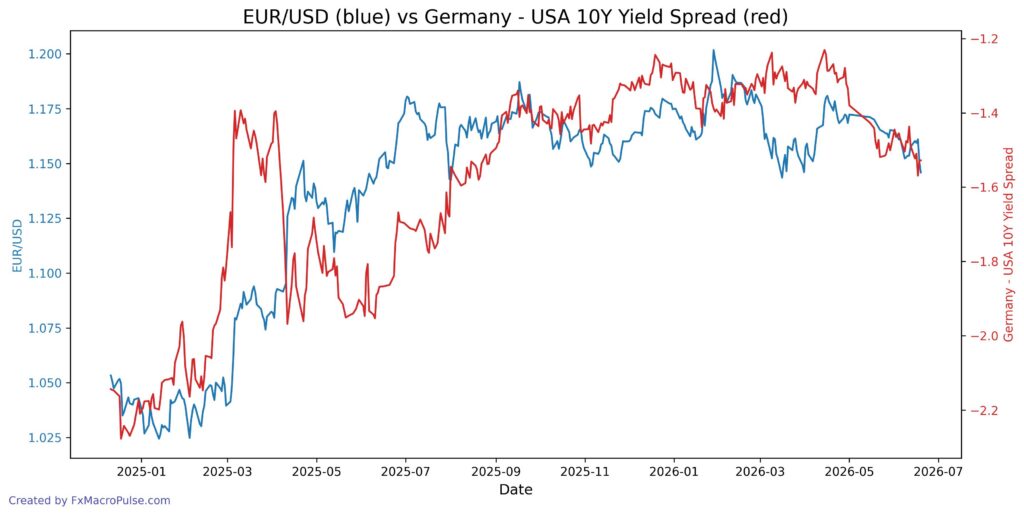
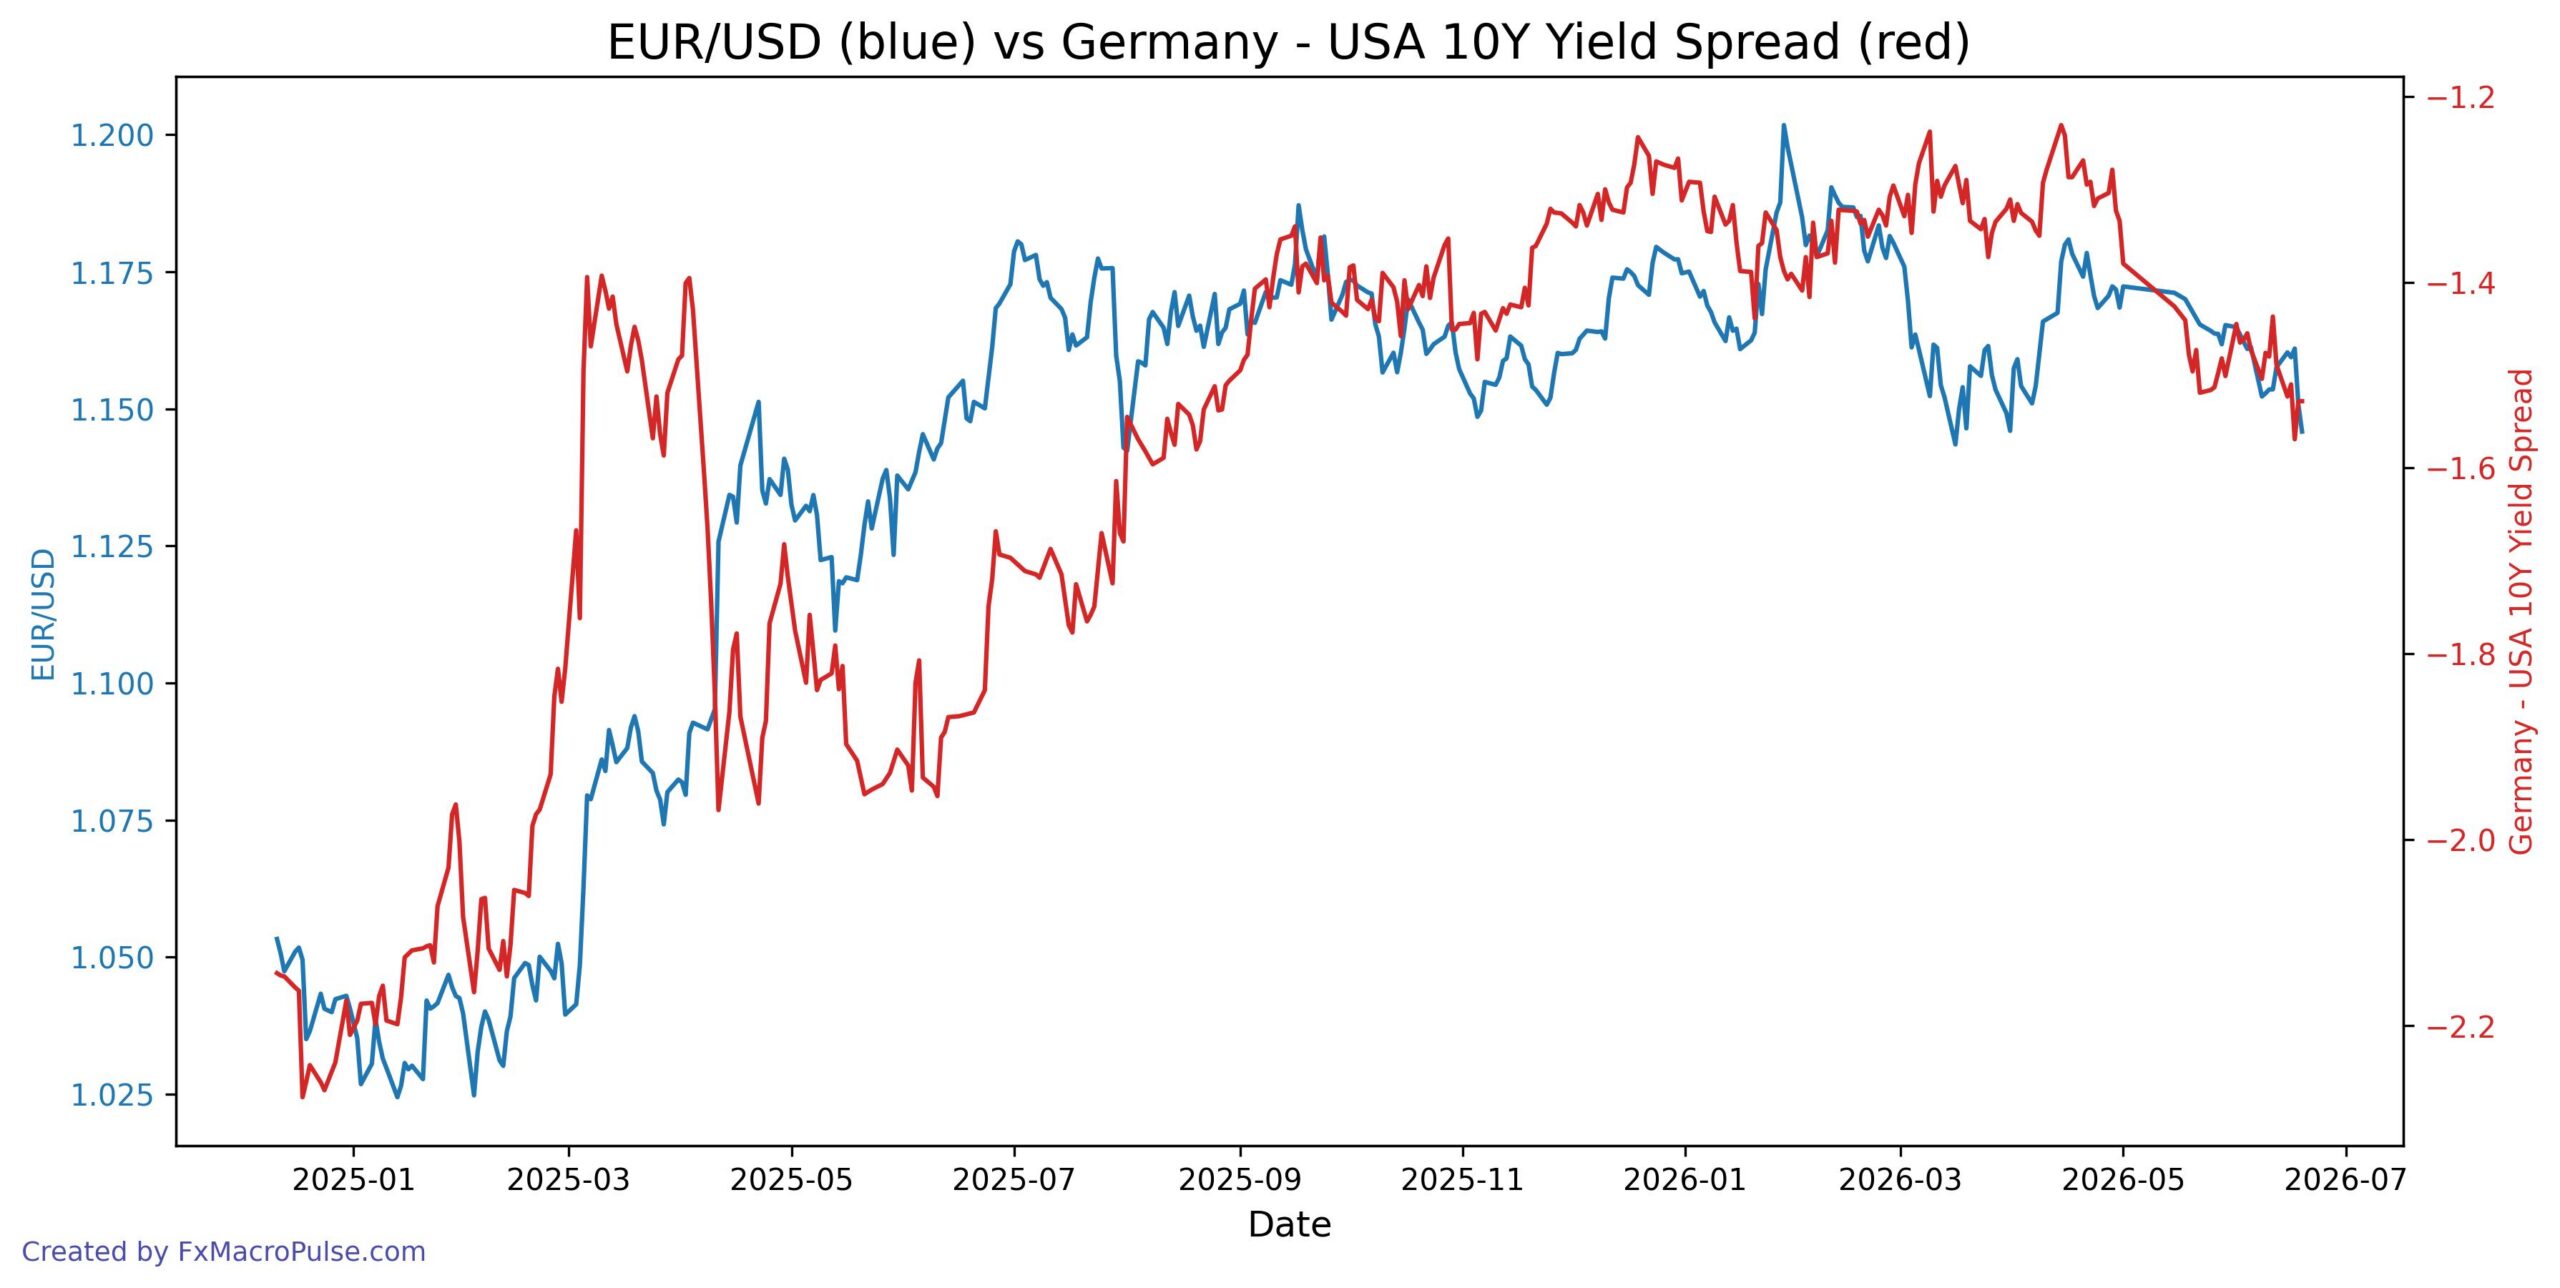
– The yield spread (EUR 10Y minus USD 10Y) narrowed from -2.14 to -1.3 over the period, supporting EUR/USD strength. Gold’s rally also boosted the Index.
– Upcoming events (Lagarde speeches June 22, Flash PMIs June 23, Core PCE & GDP June 25) could shift sentiment. Medium/high impact data may amplify or reverse the current alignment.
Trading Implications
– Look for continued alignment: if MFI breaks below 103.0, expect further EUR/USD downside toward 1.14 support.
– If PMIs or PCE surprise higher (USD), the spread could widen again, weakening EUR/USD. Conversely, weak data may push yields lower and support a bounce.
– No clear divergence warns against fading the trend – stick with the dominant direction until the correlation breaks.
COT Analysis
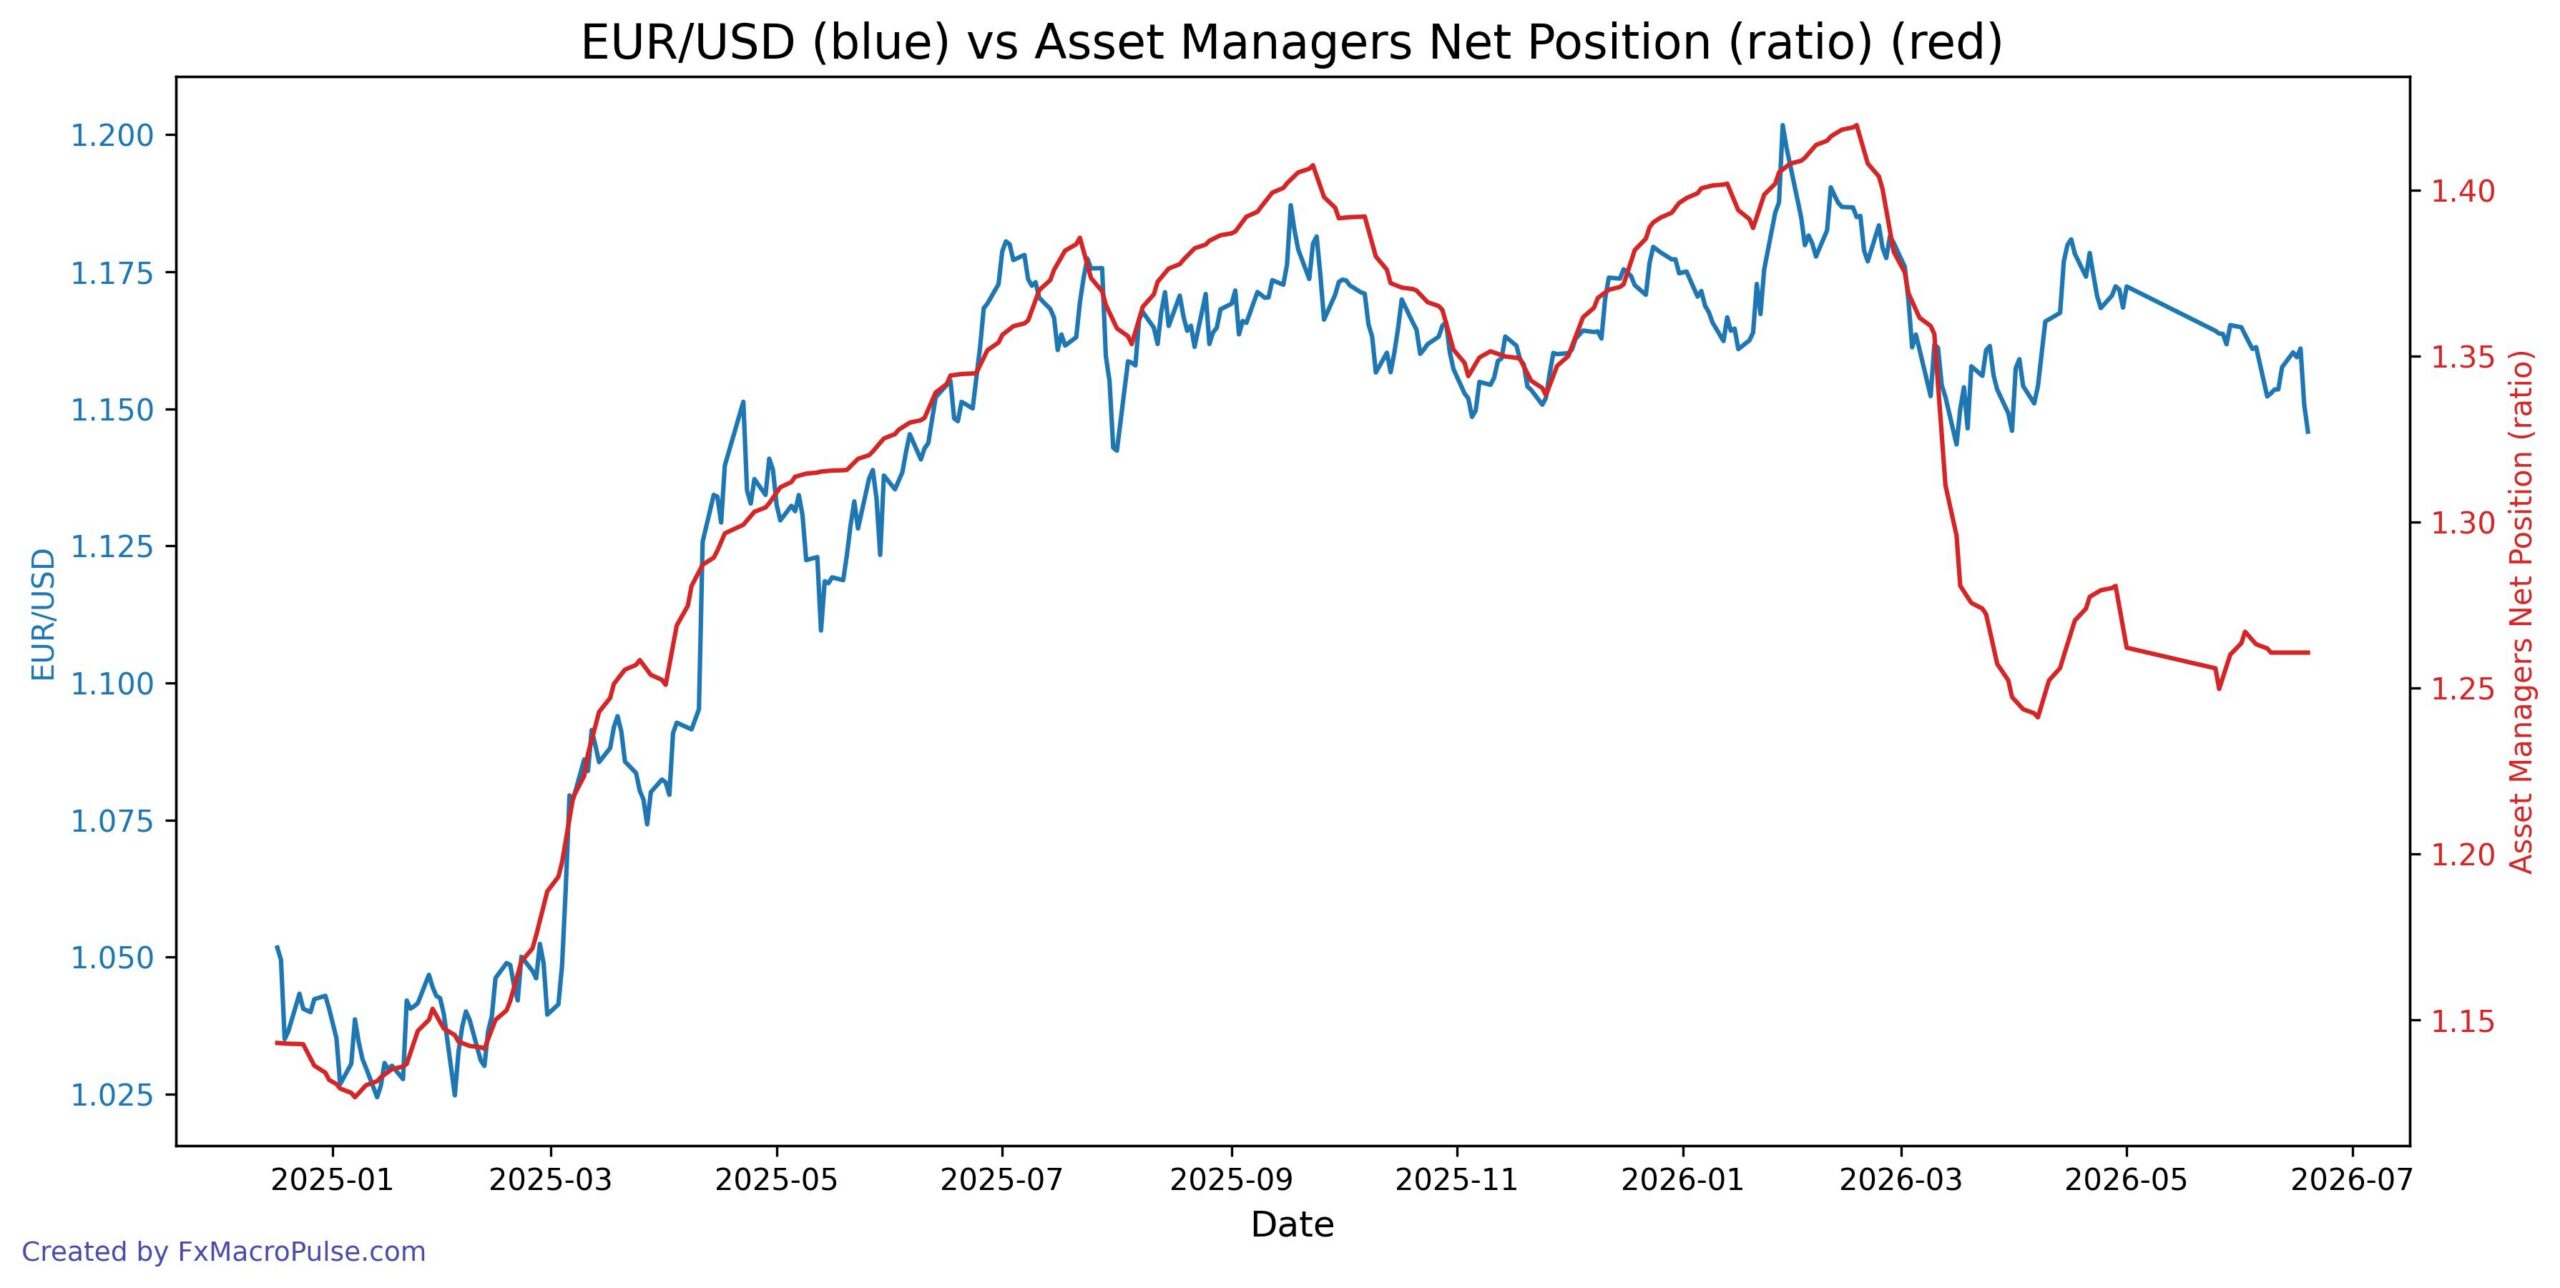
On the daily timeframe, EUR/USD price continues to make lower lows, reaching 1.145 in mid-June, while the Asset Managers Net Position ratio has stabilized around 1.26 after its own decline. This creates a bullish divergence: price is falling but the COT sentiment measure is not confirming new lows, indicating that smart money is not increasing bearish bets. The ratio’s flattening suggests a possible shift in underlying sentiment, though price remains in a downtrend. Traders should watch for price to break above recent highs to confirm any reversal signal from this divergence.
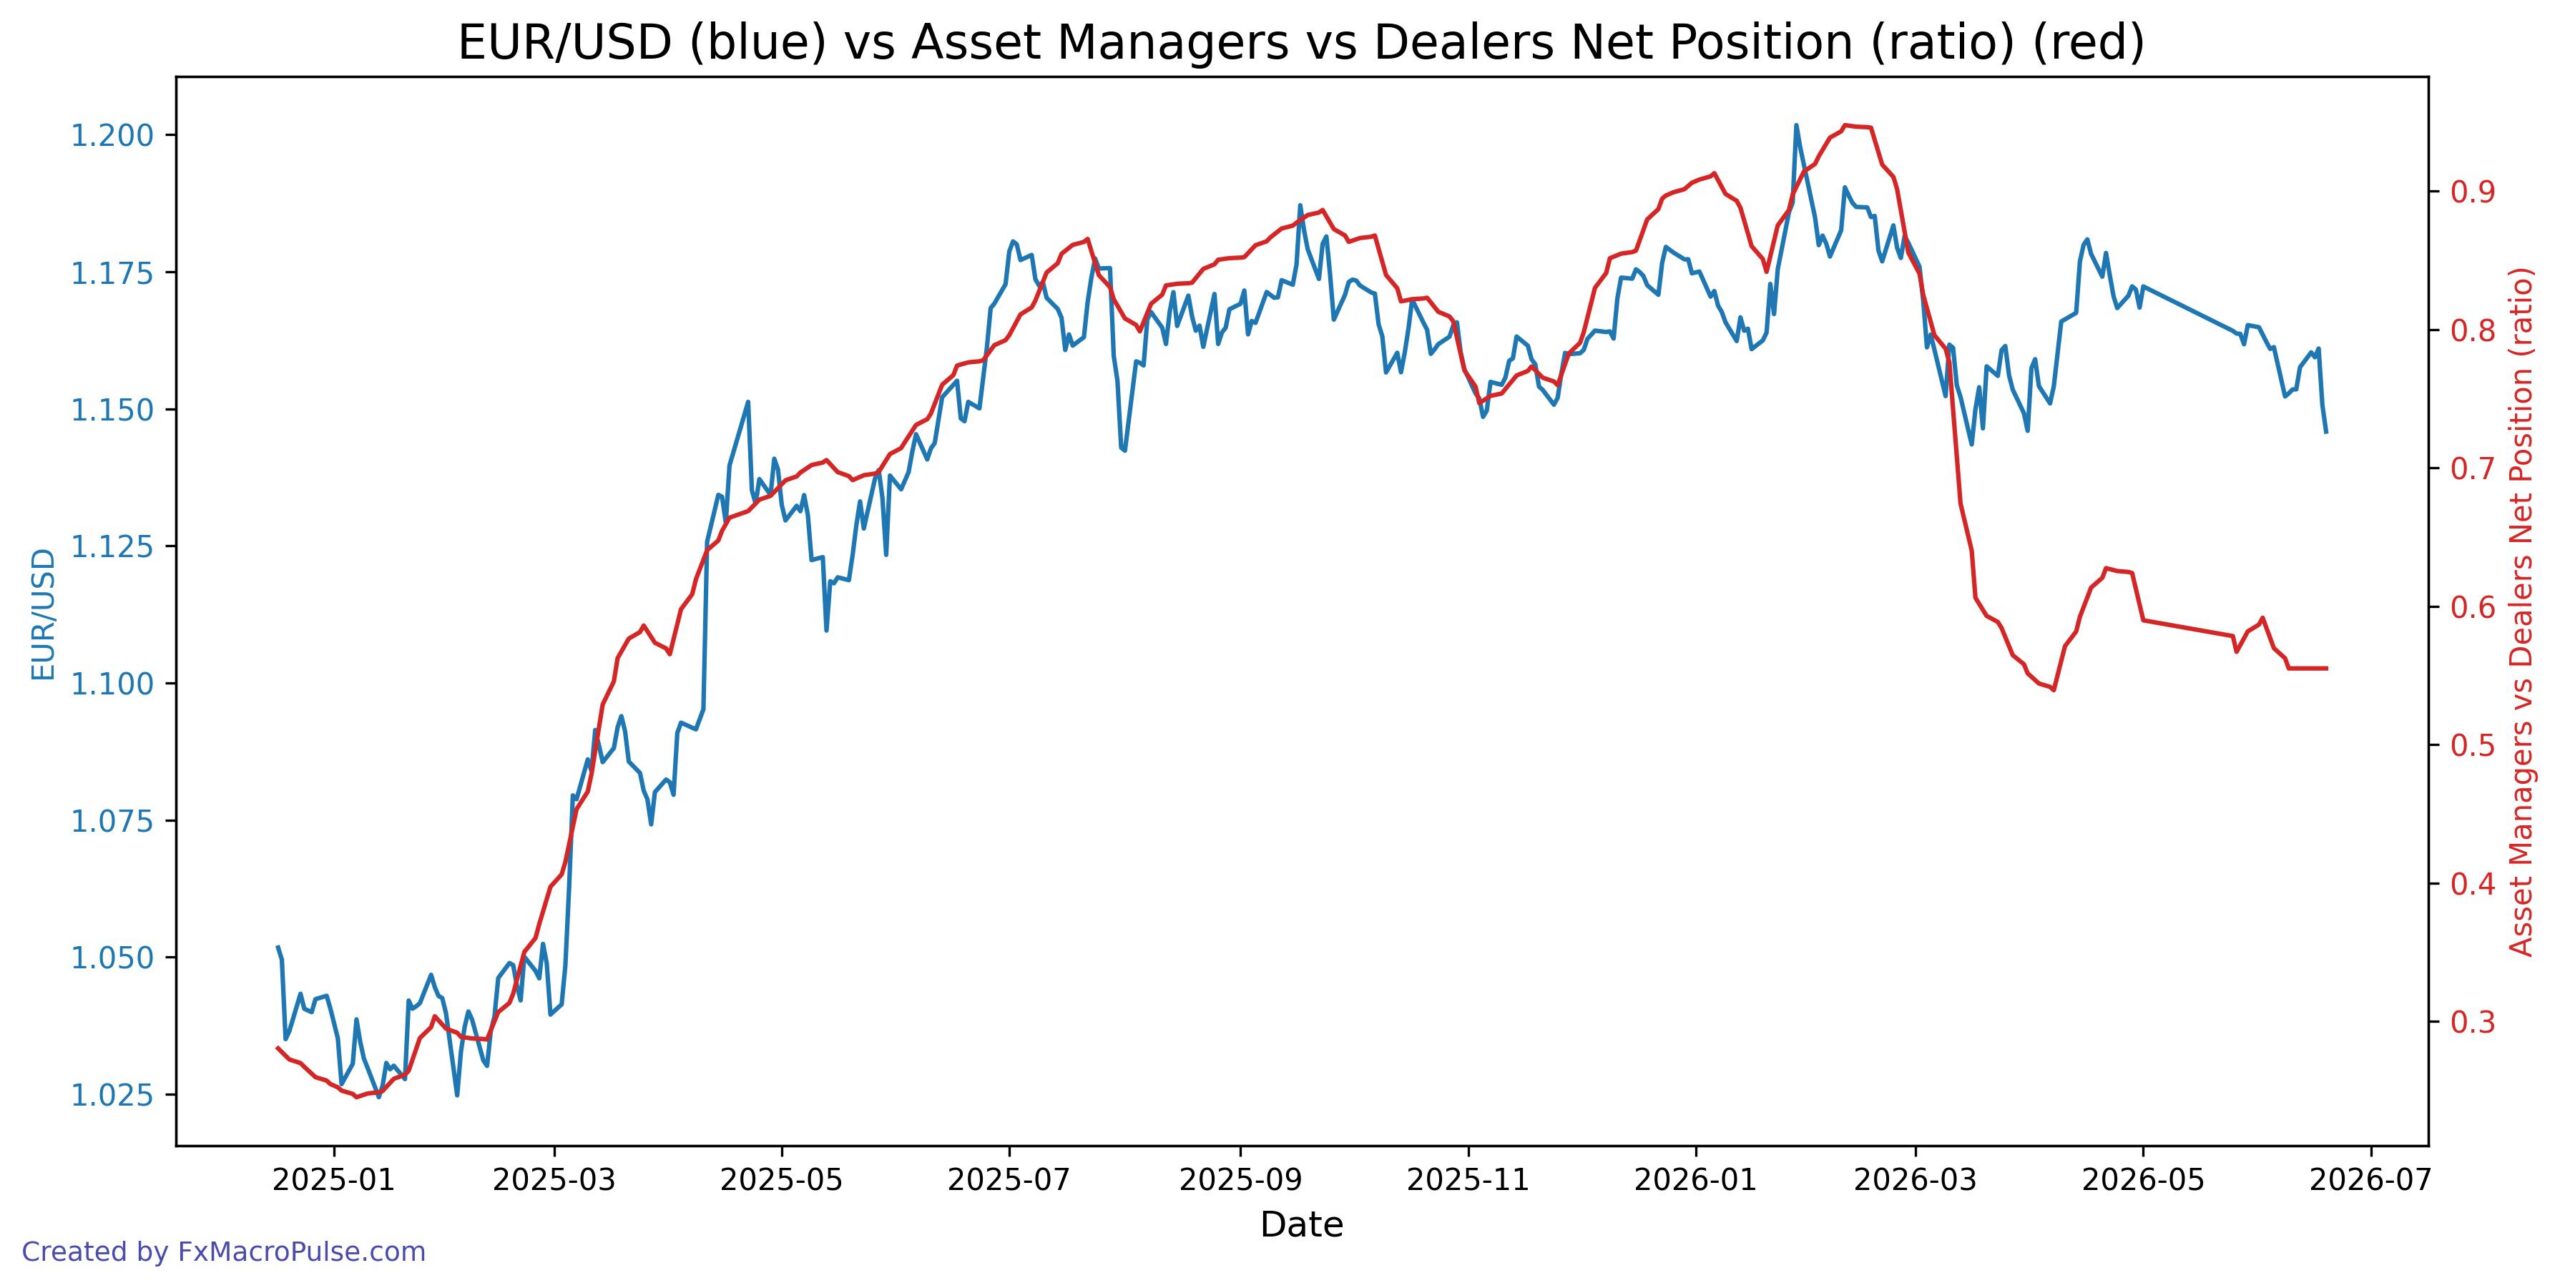
The COT data shows a clear bearish divergence: EUR/USD price continued climbing to a January 28 high of 1.2018, while the Asset Manager vs Dealer spread peaked on January 6 and then declined sharply. This indicates that professional money managers were reducing long positions relative to dealers even as the pair rallied, a warning of waning bullish momentum. Recently, both price and the spread have fallen together, with the spread dropping to low levels not seen since late 2024, confirming that large speculators have shifted to a more cautious stance. The correlation between falling price and collapsing sentiment reinforces the current downtrend on daily and weekly charts.
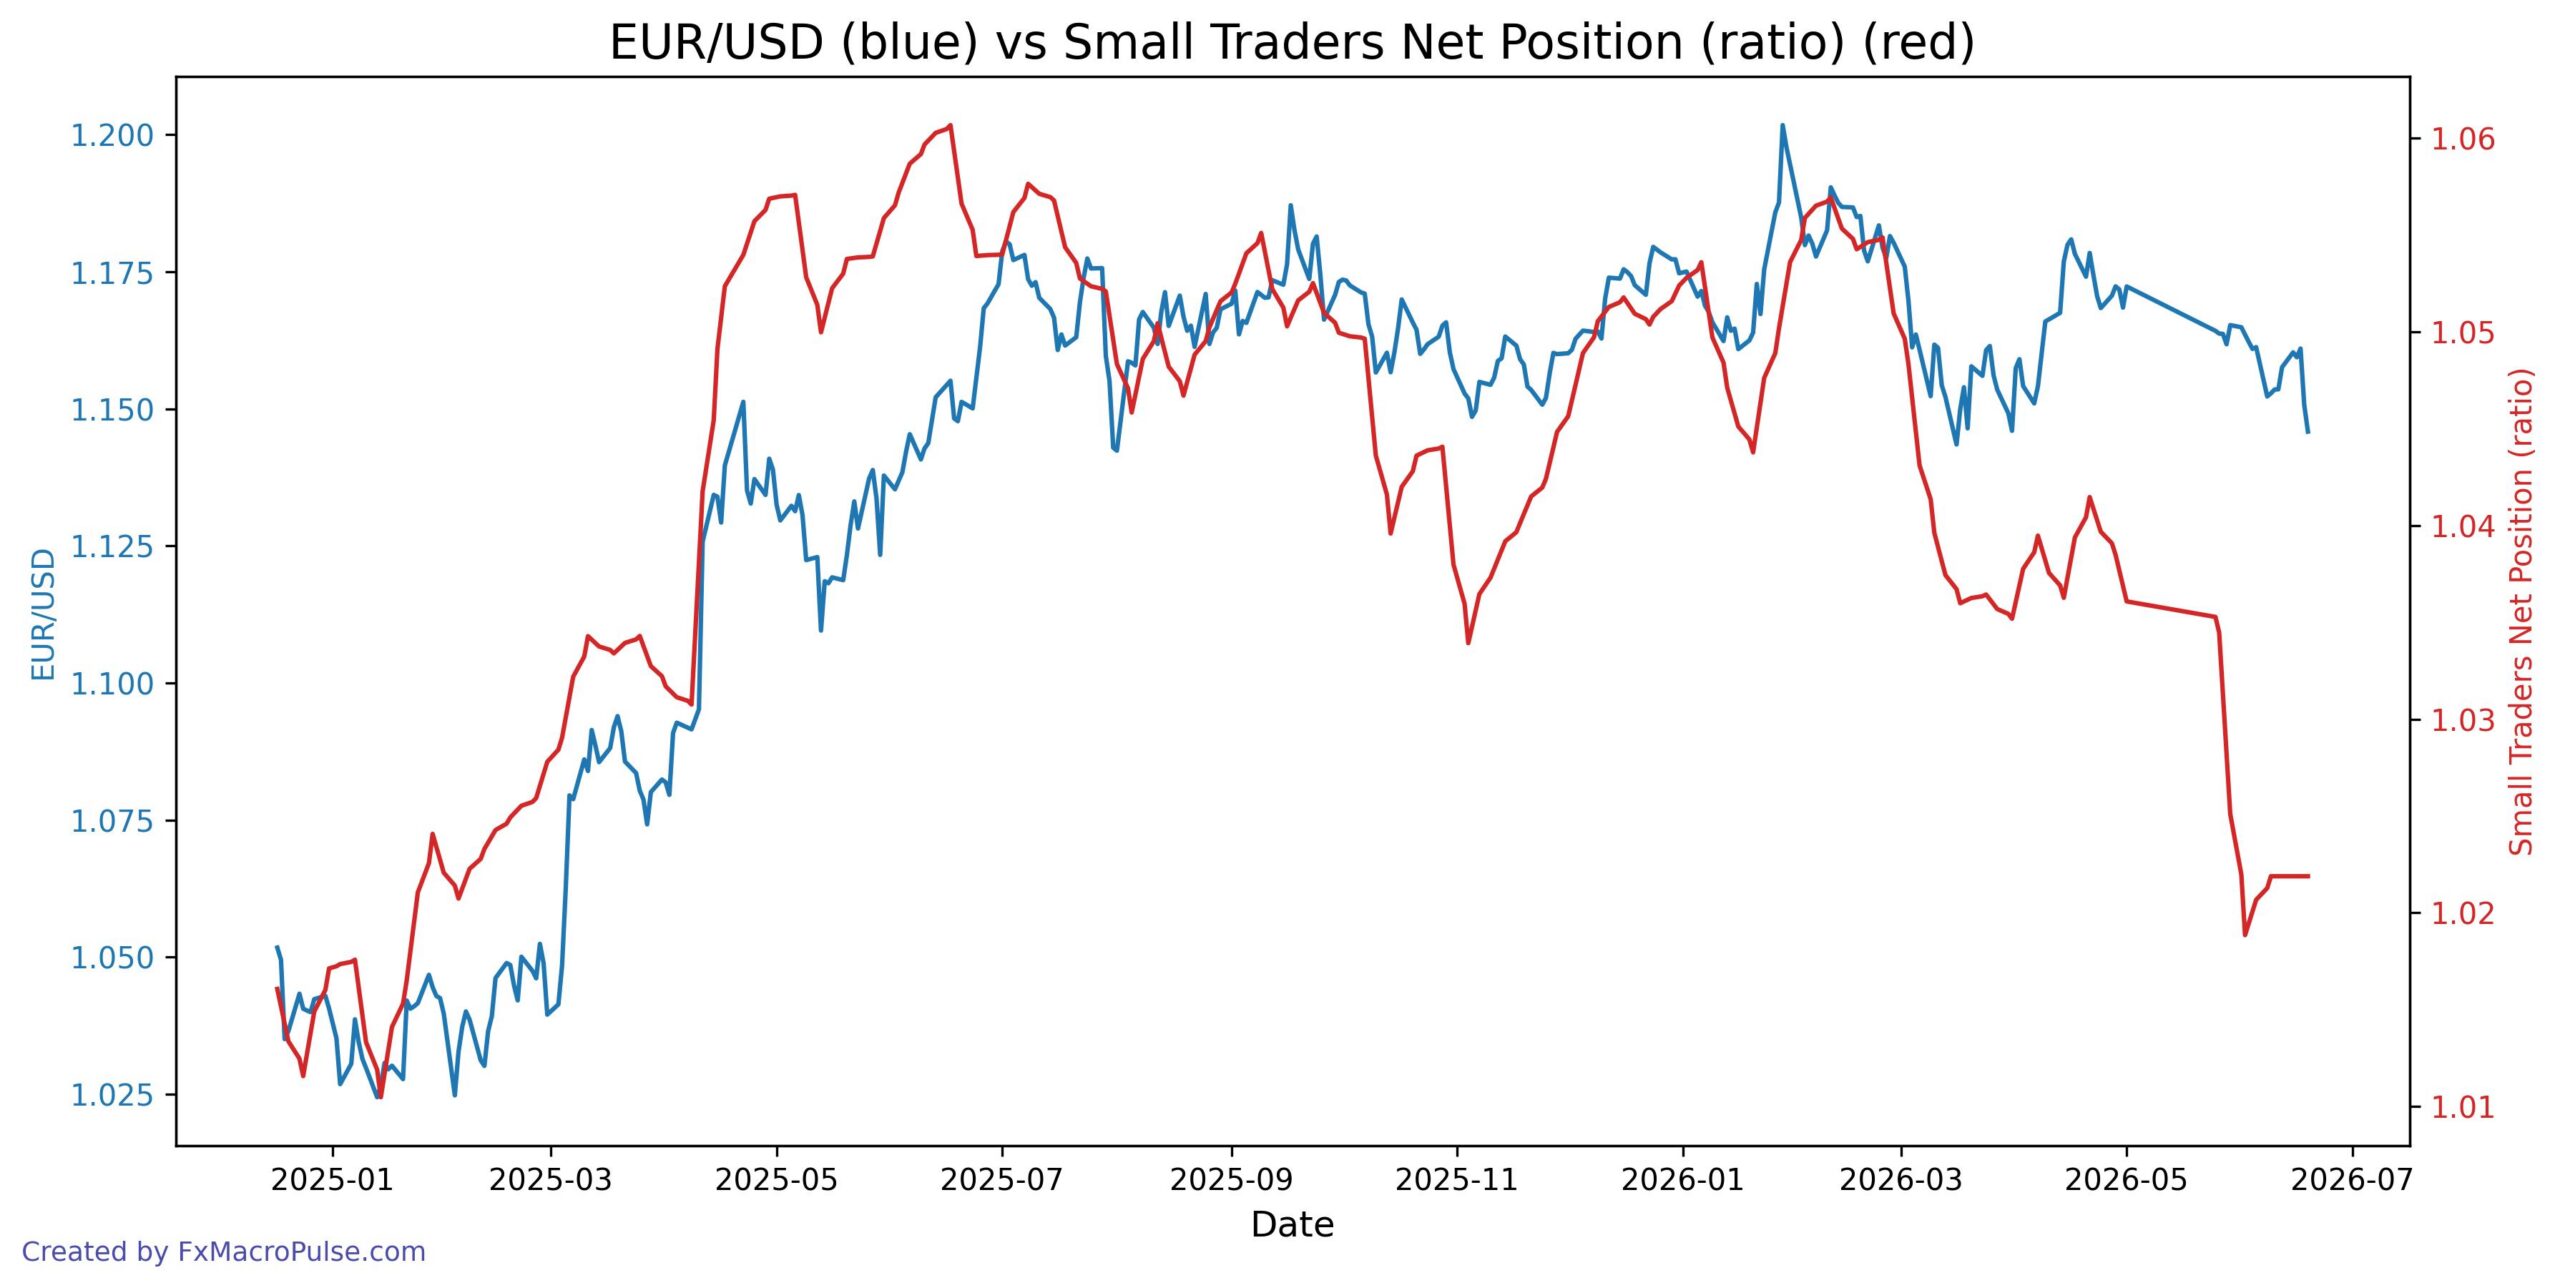
From late May to mid-June 2026, EUR/USD price oscillated in a range near 1.15–1.17, while the Small Traders Net Position ratio steadily declined from about 1.035 to 1.022. This creates a bearish divergence: price holds but small traders reduce net long exposure, hinting at underlying weakness. Over the longer term, the ratio has been falling since early 2026, correlating with the overall downtrend from the January peak—suggesting continued selling pressure despite recent consolidation.