Macro Analysis
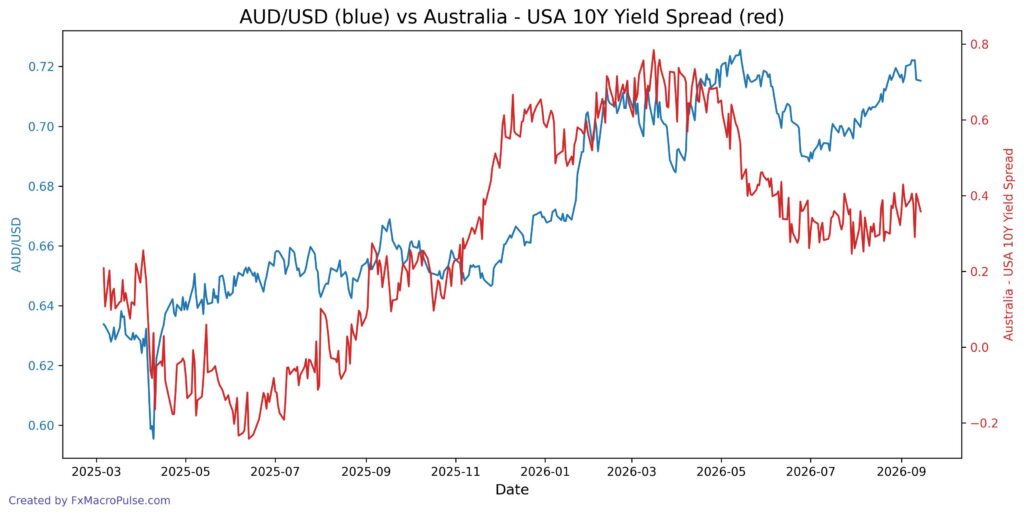
AUD/USD daily action shows a recovery from the June 30 low at 0.68824. The pair climbed to 0.72209 on September 8 and September 10, creating a short-term double top. It then slipped to 0.7156 on September 11 and 0.7152 on September 14. That pullback leaves the pair below the 0.7220 resistance but still above the 0.7120-0.7130 area. On the weekly timeframe, the pair still holds a series of higher lows from late June, so the broader uptrend remains intact unless it breaks below 0.7085.
MacroFlow tells a mixed story. Earlier, from mid-May to late June, both AUD/USD and MacroFlow fell together, a convergence phase. From June 30 to September 10, AUD/USD rose about 4.9% while the MacroFlow Index eased from 100.048 to 99.9256. That is a clear divergence: the pair rallied, but the index did not confirm the move. In the last few sessions, the pair fell from 0.72209 to 0.7152 while MacroFlow rose from 99.9256 to 100.085. That is another divergence, with the index improving as the pair pulls back. These gaps matter because the historical 0.71 correlation suggests the two often reconnect, but timing is not guaranteed.
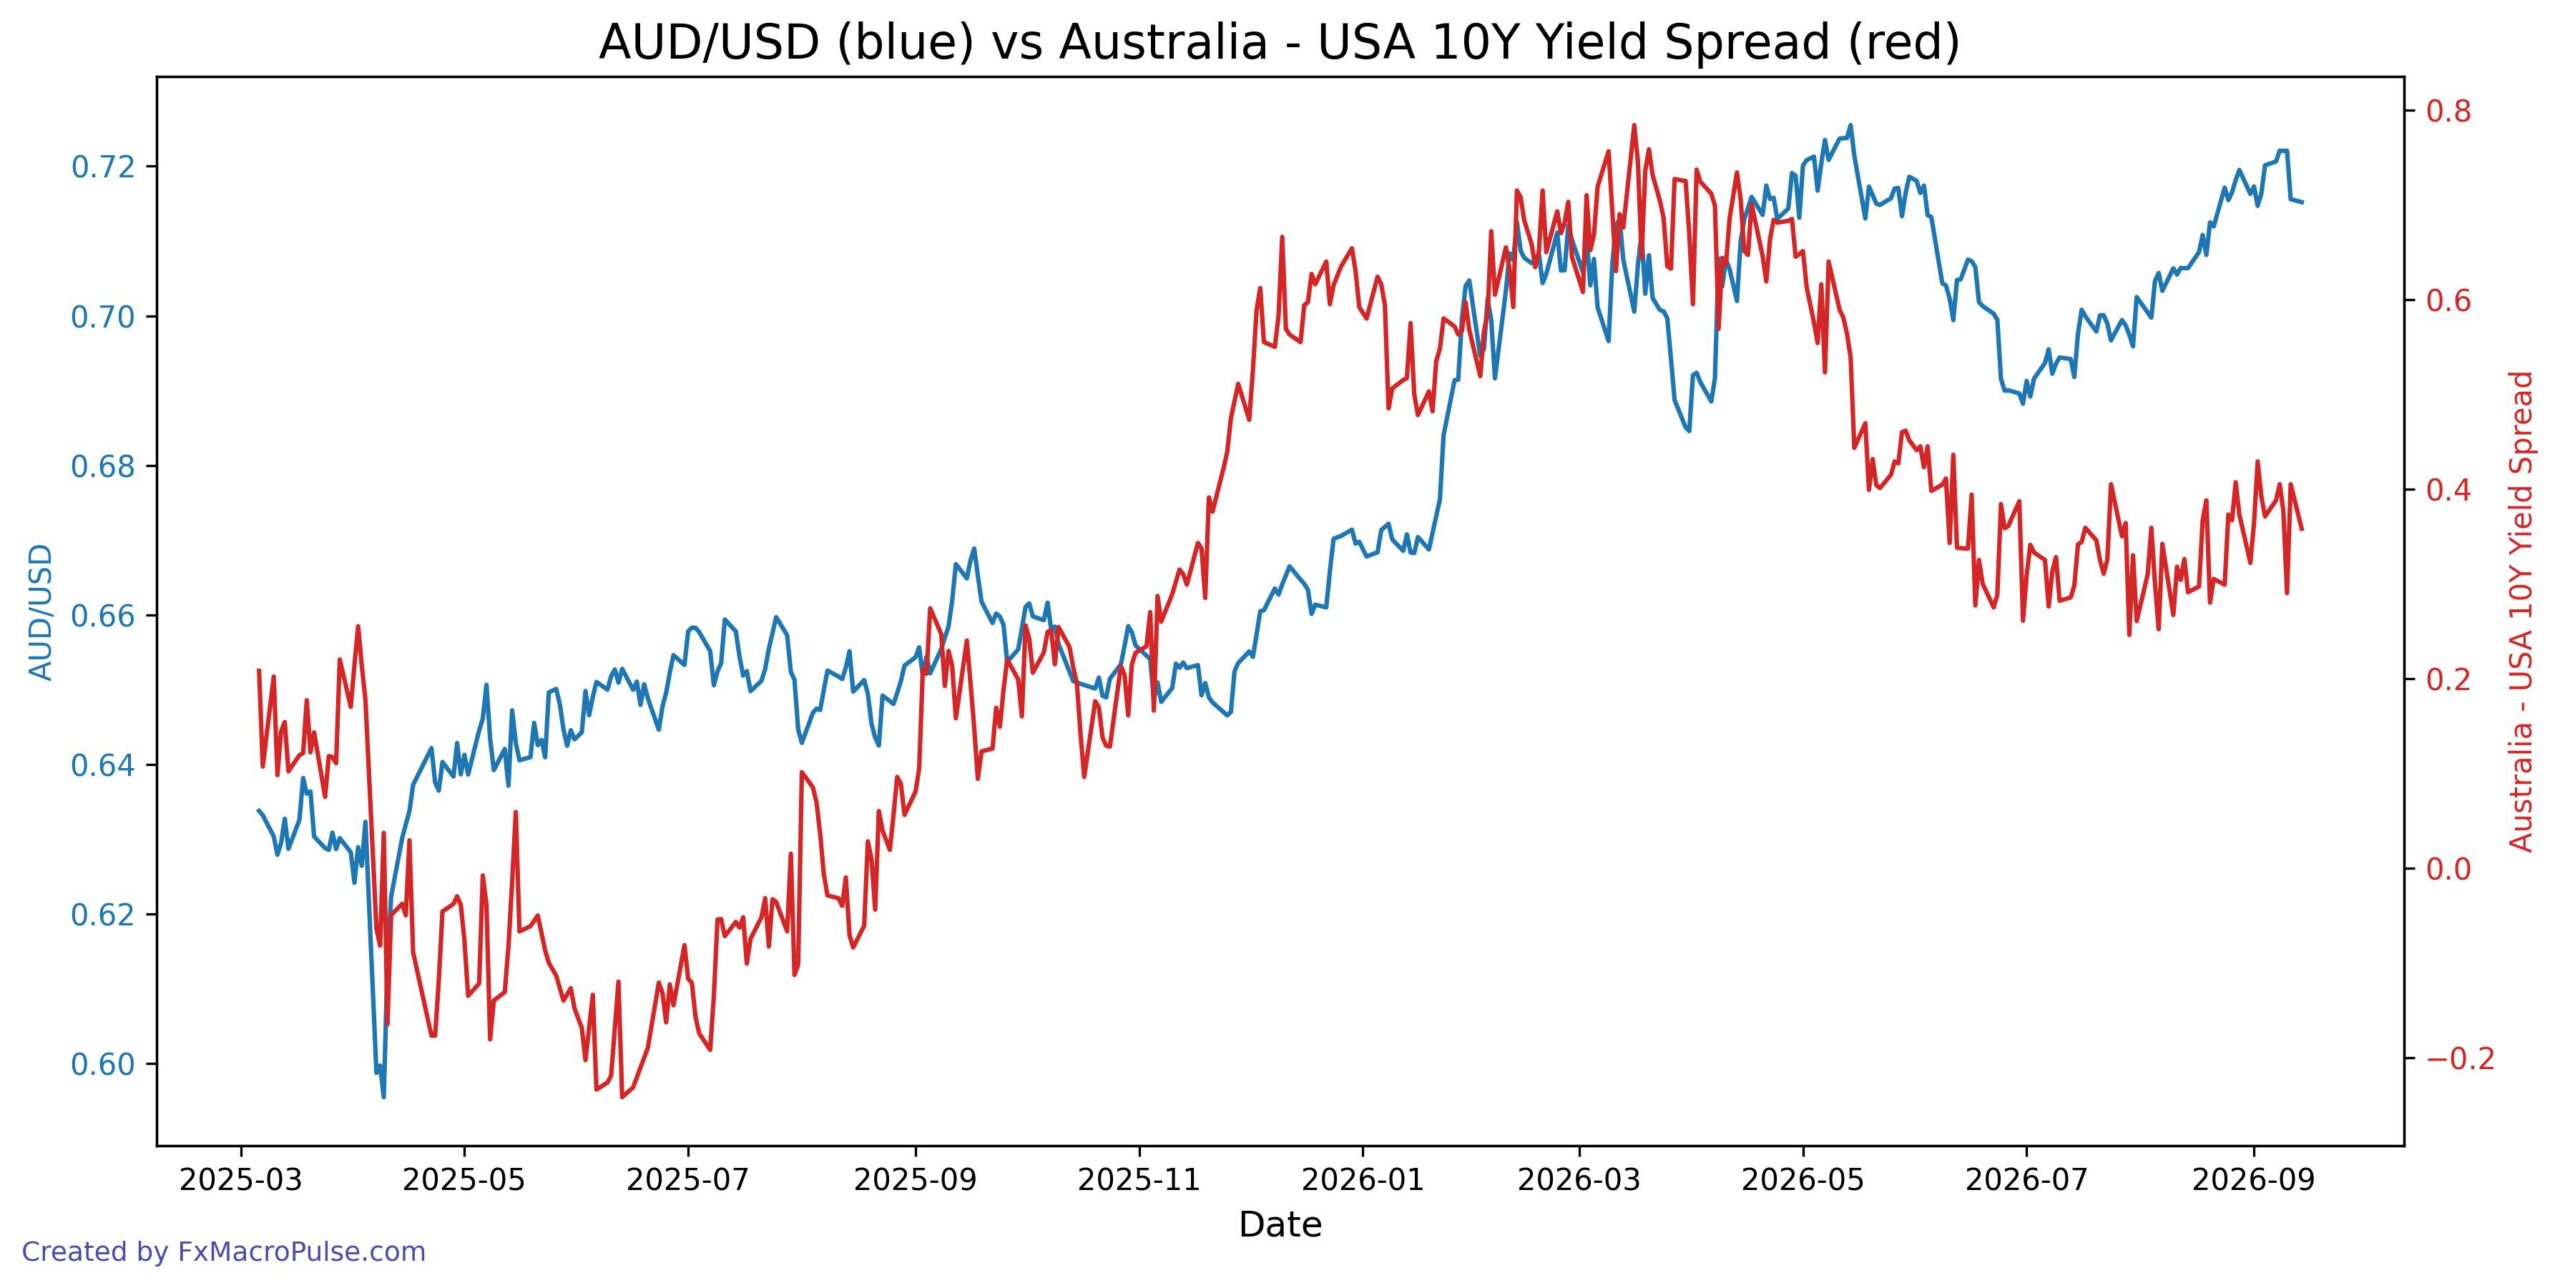
The yield spread component stays positive. On September 14, the Australia/US 10Y spread printed 0.358, up from 0.29 on September 10 but below the 0.405 seen on September 8. A positive spread supports AUD/USD from a macro view, but it has not stopped the recent price pullback. Gold and iron ore futures, plus the Australia/US stocks ratio, also feed the index. Traders can watch these inputs for clues on whether MacroFlow can hold above 100 and close the recent divergence.
Key levels for daily and weekly traders: resistance sits at 0.7220 and then 0.7255, the May 14 high. Support sits at 0.7150, then 0.7120-0.7130, and 0.7085. A daily close above 0.7220 would put the pair back near the May high. A daily close below 0.7120 would weaken the higher-low structure and shift focus to 0.7085.
Upcoming events add event risk. On September 16, the US releases Core Retail Sales and Retail Sales, then the Federal Funds Rate, FOMC Economic Projections, FOMC Statement, and FOMC Press Conference. The Fed Funds Rate forecast stands at 4.00% versus 3.75% previous, a high-impact event for USD. On September 17, the US reports Philly Fed Manufacturing Index and Unemployment Claims, while RBA Gov Bullock speaks. These events can drive short-term volatility in AUD/USD and may affect the pair’s relationship with MacroFlow.
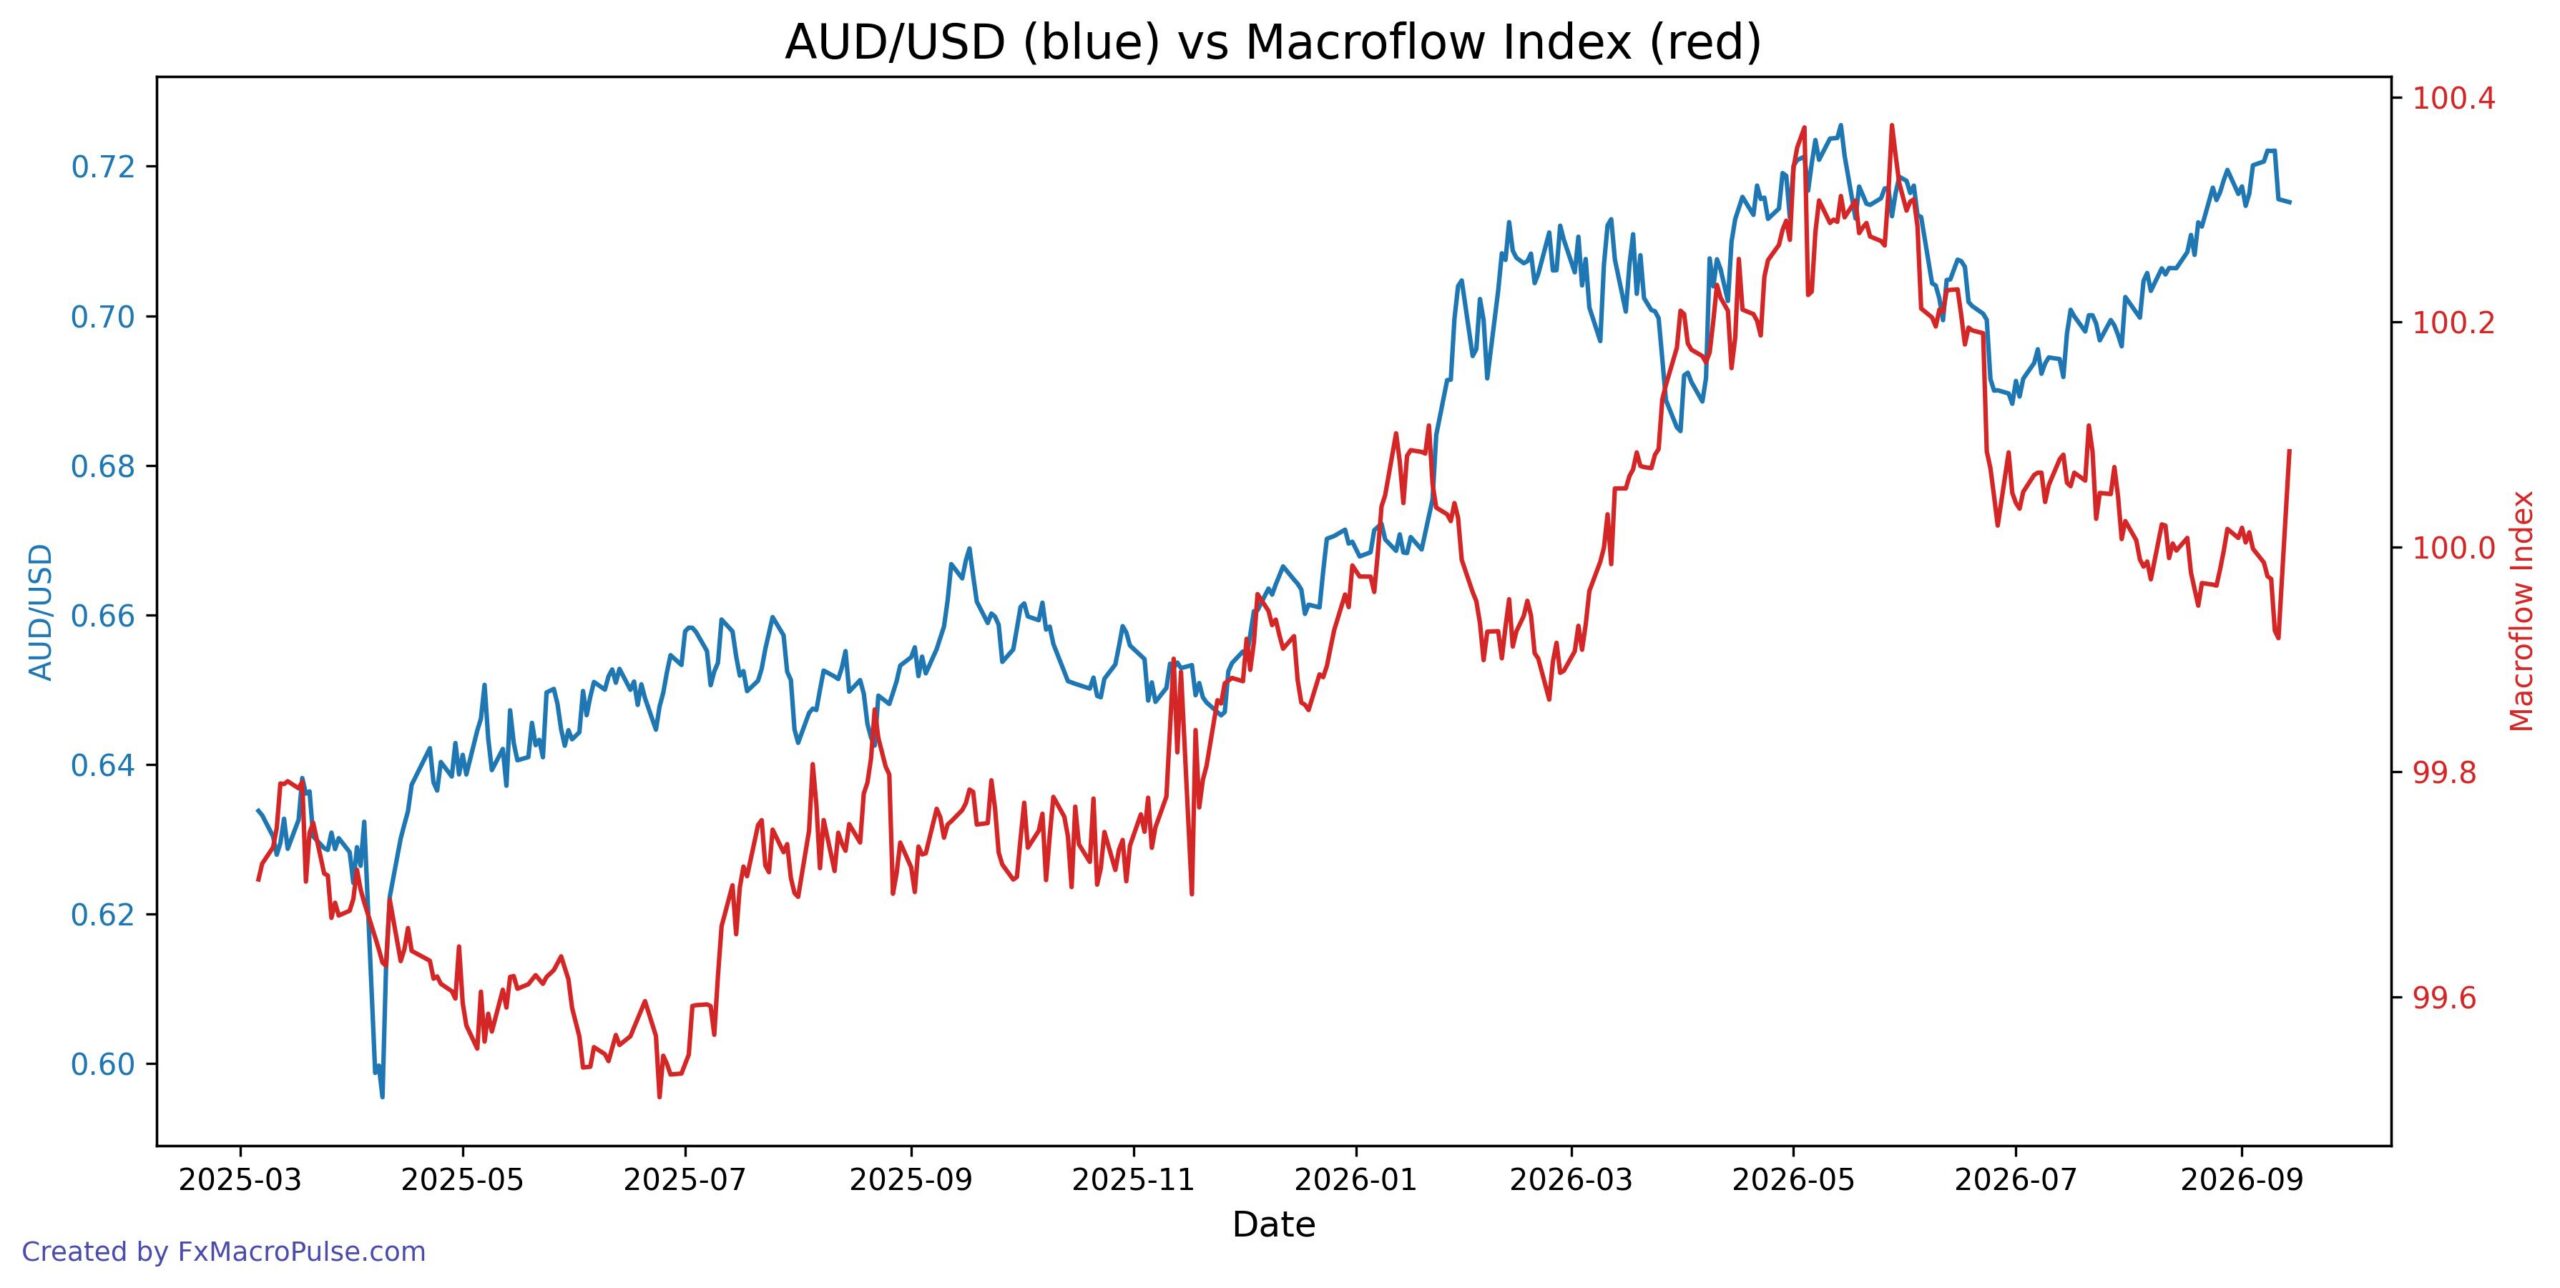
[The MacroFlow Index is a proprietary index created to track the pair’s fundamentals, and tracks the following: Australia/US 10Y Gov. Yield Spread, Australia/US Stocks Index Ratio, Gold Futures, Iron Ore 62% Fe CFR China Futures. The index has a historical correlation of 0.71 with AUD/USD. It moves positively with all four inputs, so a rising index usually supports AUD/USD, while a falling index usually weighs on it.]
COT Analysis
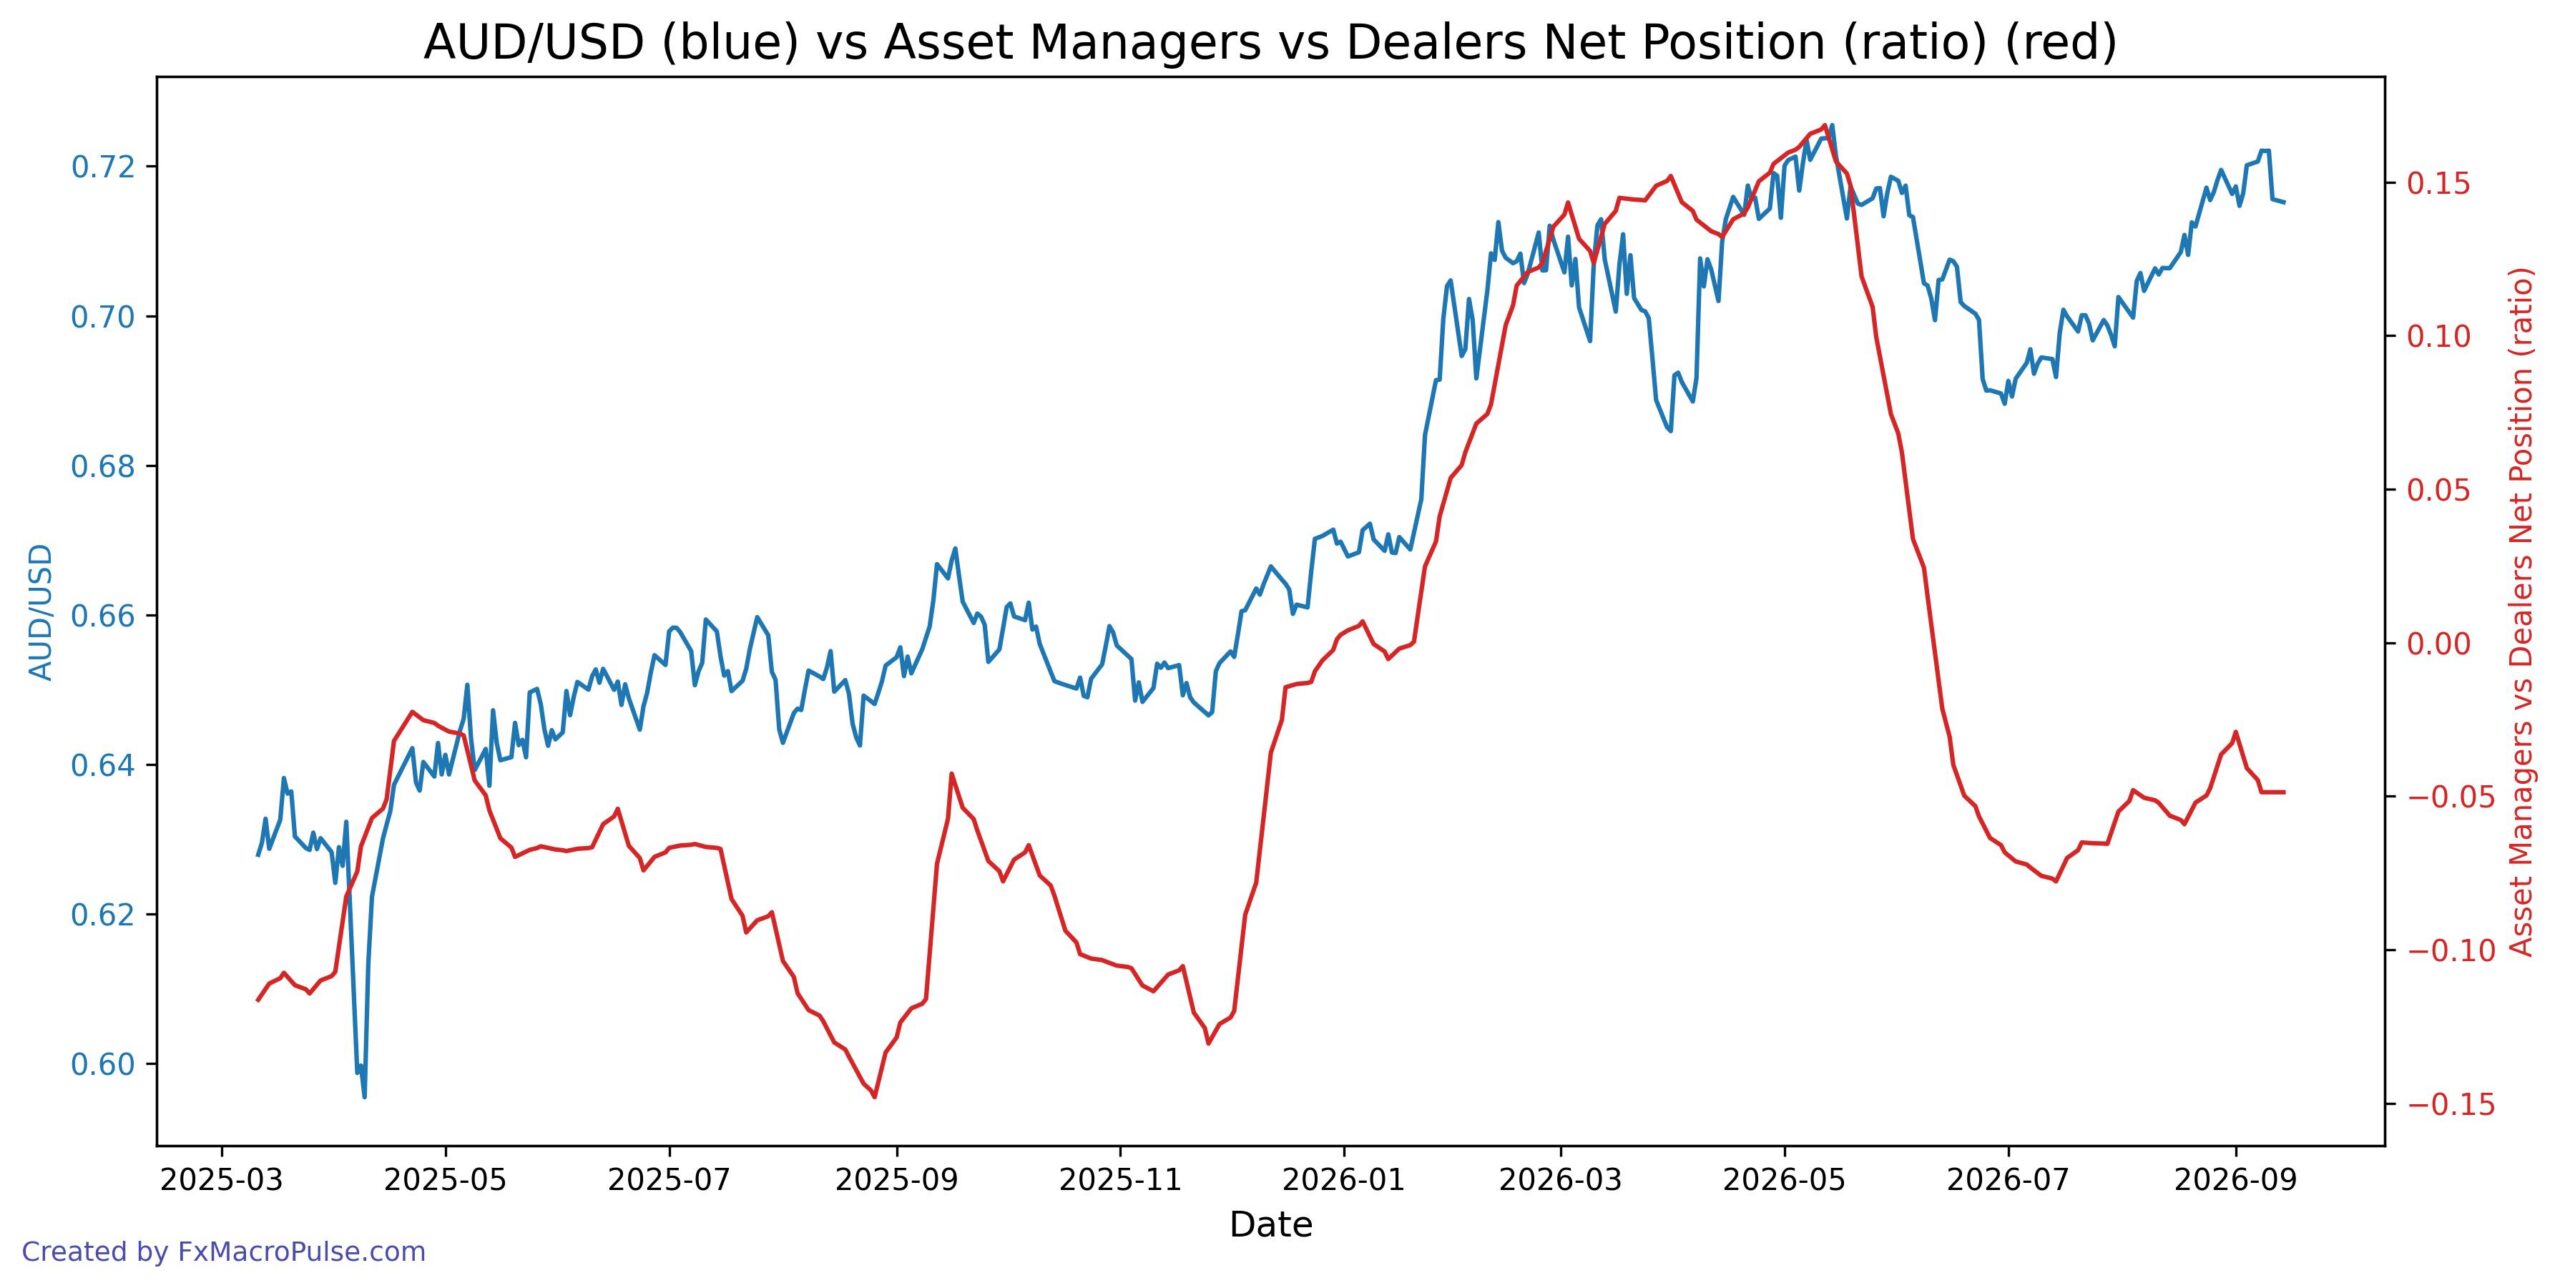
On the daily chart, AUD/USD has slipped from 0.7221 to 0.7152 in recent sessions, while the Asset Managers vs Dealers spread sits unchanged at -0.0487 after dropping from -0.0291 on 1 September. That earlier decline in the COT spread while price pushed higher shows divergence, suggesting the rally lacked fresh asset-manager backing. The pair still holds most of its weekly recovery from the late-June low near 0.6880, but the flat spread now shows price and positioning in a holding pattern rather than confirming a clear trend.
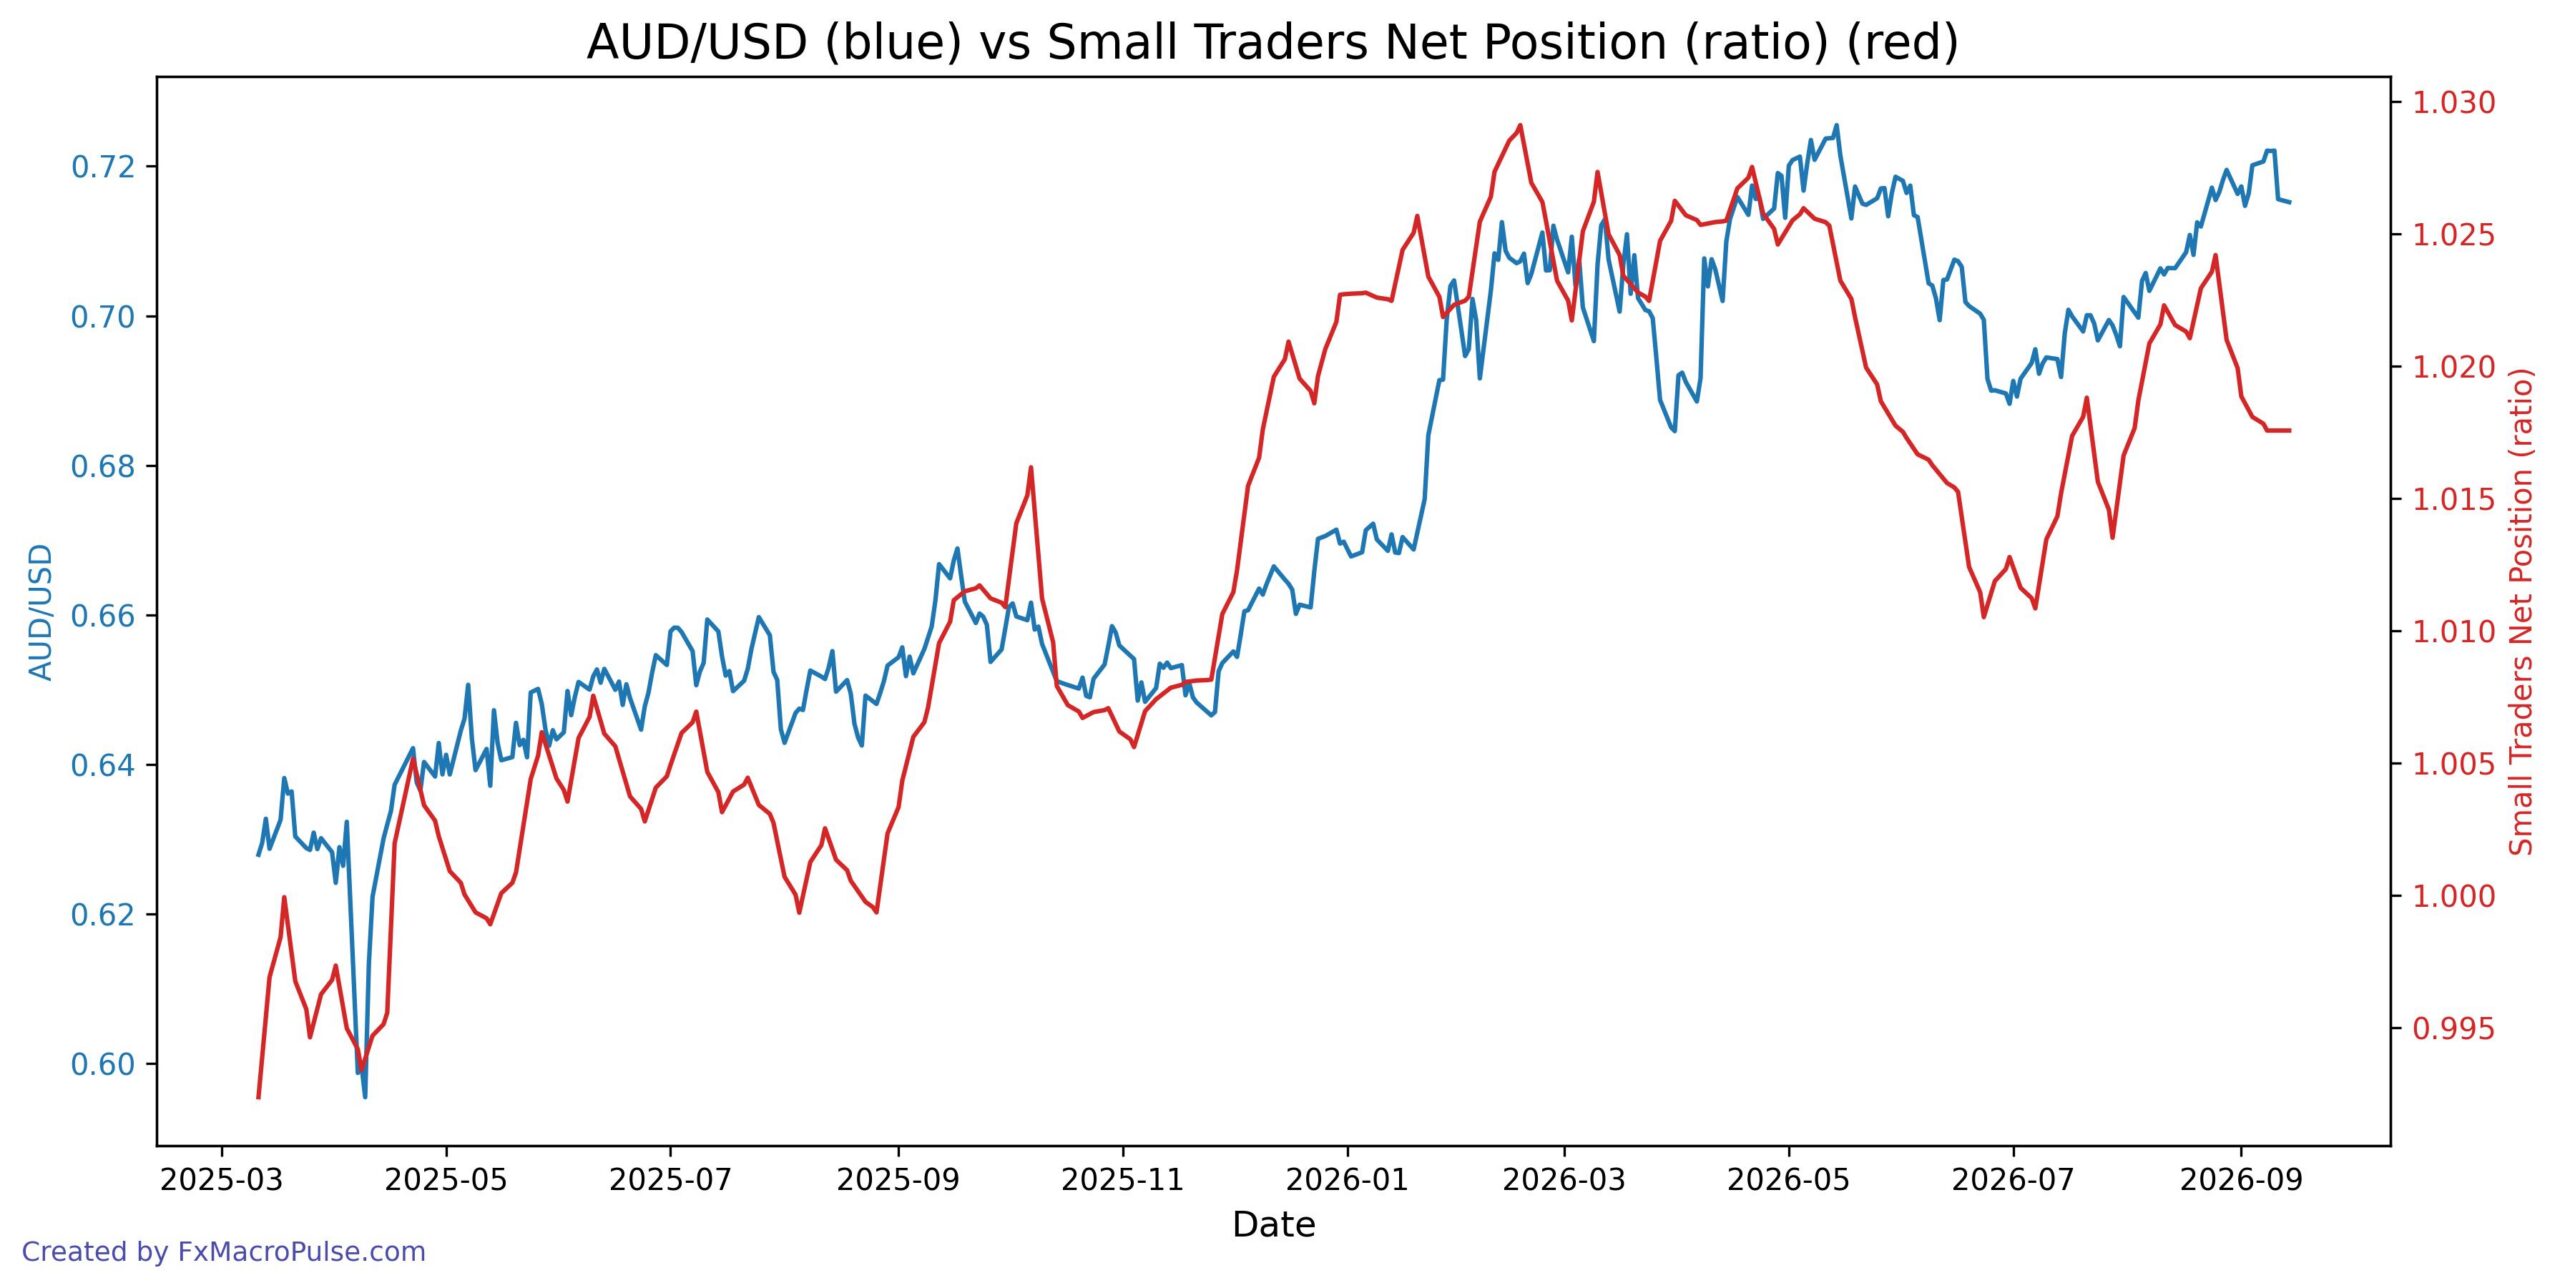
On the daily chart, AUD/USD has pulled back from the 0.7220 area to about 0.7150, giving back part of its recent rebound while holding above the 0.7000–0.7050 weekly support zone. The Small Traders Net Position ratio has flattened near 1.0176 after easing from 1.0242 in late August, so small-trader positioning no longer rises with price and now shows mild divergence as the pair slips. For daily and weekly traders, the key is whether price stabilizes above 0.7150; a deeper drop would contrast with steady small-trader exposure, while a quick reclaim of 0.7220 would bring price and positioning back into alignment, with macro attention still on RBA-Fed rate expectations and risk appetite.
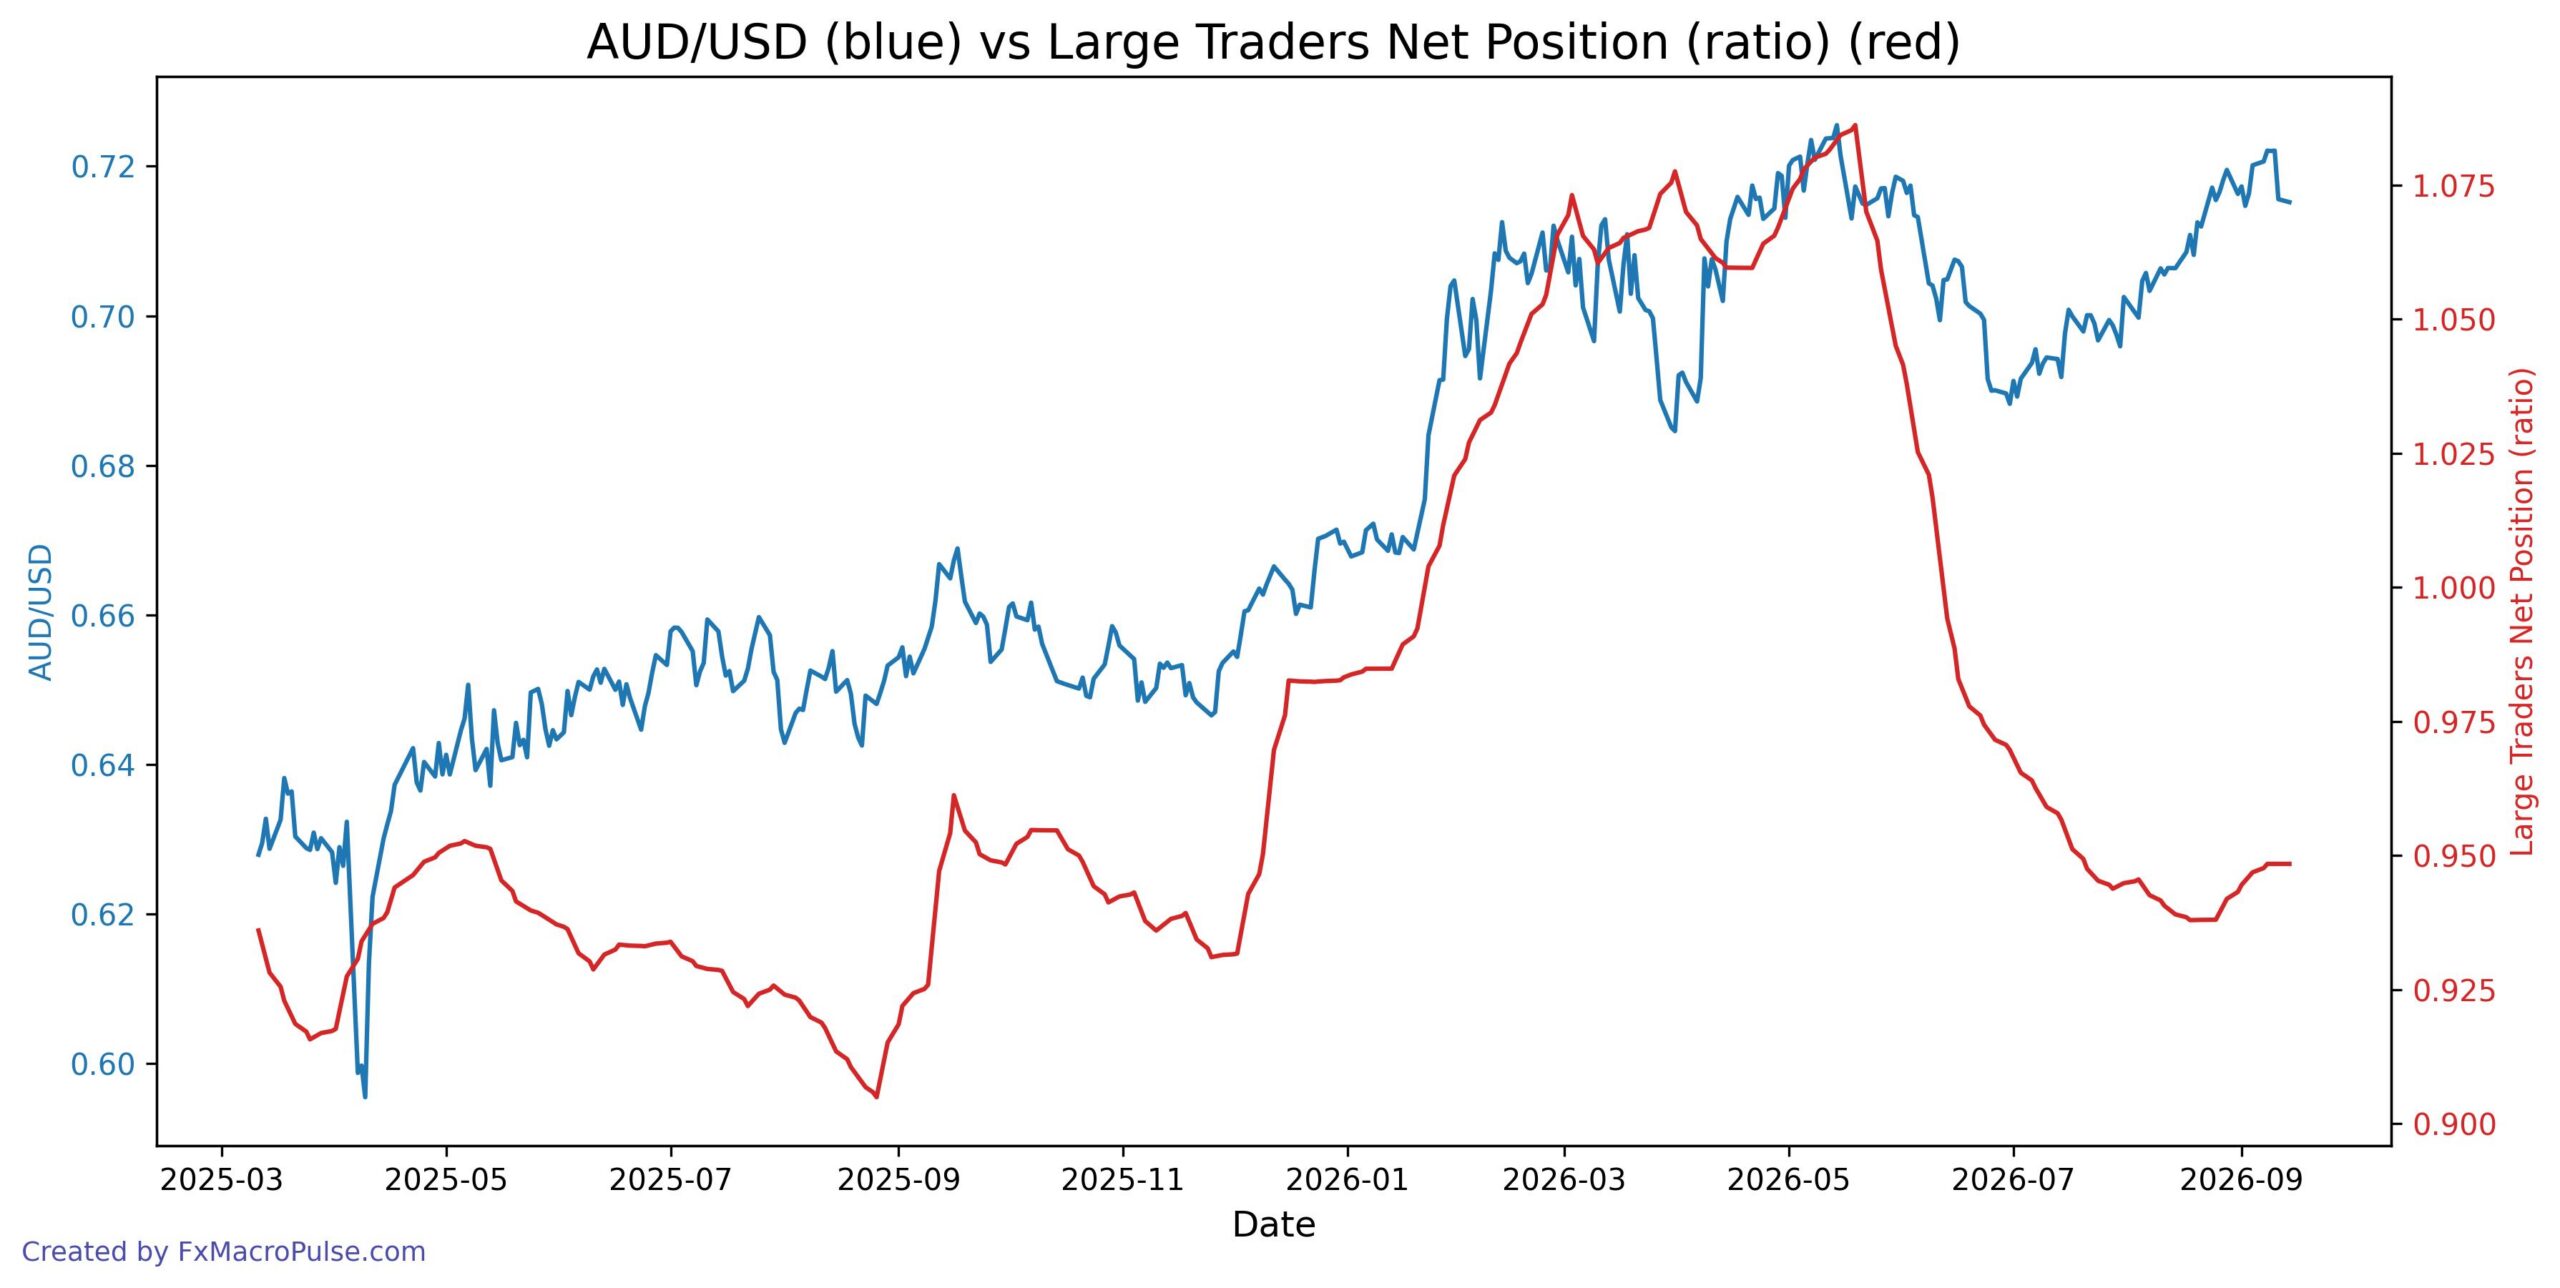
AUD/USD recovered from the 0.700 area in August 2026 to a high near 0.7220 in early September, then slipped back to around 0.7150. The Large Traders Net Position ratio fell from a May 2026 peak above 1.08 to about 0.938 in late August, diverging from the pair’s resilient price, but it has since risen to roughly 0.948 as price also rebounded. This recent convergence shows large-spec positioning is stabilizing, yet the ratio remains well below its May peak, so daily traders watch whether price can hold above 0.7150 support to keep the recovery intact.
News and Geopolitics
The AUD/USD bias remains mildly bearish as the US-Canada trade dispute and US-Iran tensions support the dollar through safe-haven demand and energy-driven yield differentials, though the looming expiration of the US-China truce introduces a genuinely two-sided catalyst. Australia’s mixed strategic realignment adds little decisive direction, leaving the pair exposed to headline risk. Overall, significant uncertainty persists, and traders should weigh each development against shifting risk sentiment rather than treating any single driver as definitive.