You can read a chart perfectly and still lose, because the chart was drawn for a rate environment that no longer exists. That is the gap most retail traders fall into. They collect macro information without deciding what to check first, and in what order.
What is Forex macro analysis all about?
Forex macro analysis is about asking a fixed set of questions about the two economies behind a pair, before you take the trade. It beats lagging indicators because technicals describe moves that already happened. E*TRADE’s own education page calls the 50-day SMA “a lagging indicator” and RSI “a widely used lagging momentum oscillator,” and warns that indicators “should not be taken as definitive signals of upcoming price moves” (E*TRADE from Morgan Stanley, 25 Oct 2024).
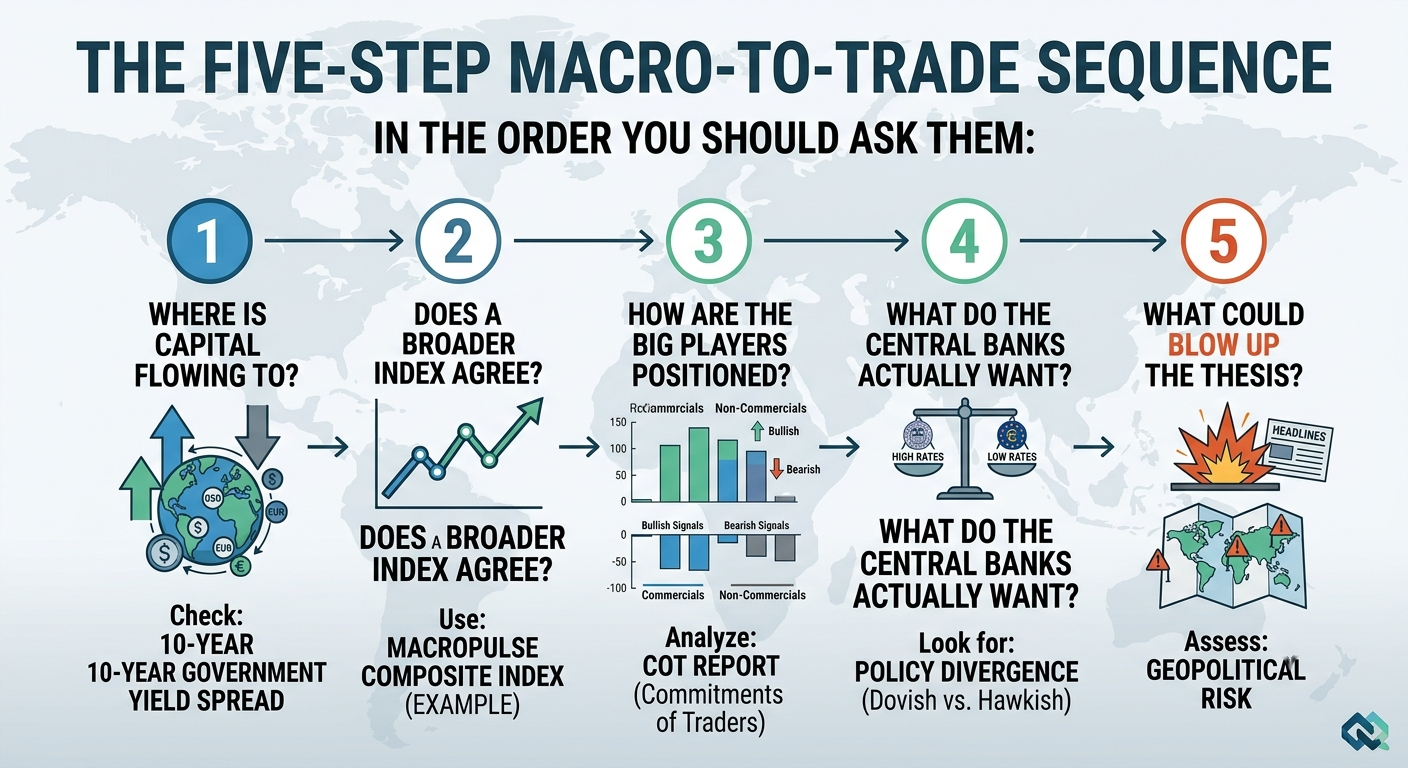
The five questions, in order:
- Where is capital flowing? (10-year government yield spread)
- Does a multi-asset composite index confirm it? (the MacroPulse Index)
- How are big players positioned in the market? (COT positioning)
- What do the central banks actually want? (policy divergence)
- What could break the thesis? (geopolitical risk)
So, fundamentally, what drives exchange rates? The Central Bank of Iceland lists the long-term drivers: foreign trade, terms of trade, commodity prices, interest rate spreads with abroad, and inflation. Then it adds the part that matters for your stop-loss: “in the short term, the exchange rate can change due to speculation and changes in investors’ risk appetite” (Central Bank of Iceland).
Over the long run, macro wins. Over the short run, positioning and traders’ sentiment win. The five steps below cover both — which is why the last two steps are the ones most people skip.
Step 1: Follow the money — check the 10-year yield spread
Start with the 10-year government bond yield spread for your pair. It is the cleanest single measure of which currency currently pays more to hold, and every later step is a check on whether that pull is real or already exhausted.
A yield spread is the difference between two countries’ government bond yields. The Corporate Finance Institute defines the net interest rate differential as “a difference in interest rates between two countries or regions” (Corporate Finance Institute). No major central bank glossary appears to define “yield spread” itself. It is practitioner language.
The mechanism is well documented. ECB Executive Board member Benoît Cœuré described how asset purchases, “by compressing the (excess) return on domestic bonds,” “encourage investors to rebalance their portfolios towards foreign, higher yielding assets” (ECB, 3 Nov 2017). Flow follows yield. That is the whole idea.
Worked example, USD/JPY. Take the US 10-year Treasury yield and subtract the Japanese 10-year yield. Two things matter, and the second matters more: the direction (is the spread widening toward the dollar?) and the rate of change (is that move accelerating?). A spread sitting at 3.00% and stable for a year tells you nothing tradable. A spread that moved 40 basis points in three weeks tells you capital is being pulled somewhere.
Do not treat a positive spread as a buy signal on the higher-yielding currency. The correlation is regime-dependent. Cœuré’s figures show the 2-year rate differential versus EUR/USD at “a remarkable 0.85 during the period 2005 to 2011,” while the 10-year expectations component ran near 0.75 in 2012 to 2013 but below 0.4 in the mid-2000s. Same indicator, different reliability depending on the era. That is why Step 2 exists.
Pull up the 10-year government yield spread for your pair and figure out where it’s heading and how fast. If you can’t tell from the chart, you’re missing the big picture.
Step 2: confirm it with intermarket analysis
The yield spread alone can be misleading. A composite of correlated inputs disagrees with reality far less often, so the second step is confirmation rather than discovery.
This is where most single-indicator macro tools stop, and it is the step the MacroPulse Index was built around. Instead of eyeballing a spread in isolation, you let one signal combine the yield-spread read with the moves in assets that historically trade alongside it for that pair. Commodity currencies track their export commodity. Risk-sensitive currencies track equity risk appetite. The dollar tracks relative growth and haven demand.
Why does bundling help? Because the underlying relationship is unstable, and a single series can fail silently while a composite keeps working. The Federal Reserve Board’s FEDS Note on the 2021 to 2023 tightening cycle found aggregate data “do not suggest a systemic relationship between exchange rate movements and changes in expectations for relative monetary policy stances,” with an all-country 2022 slope of −0.17 (p=0.82, R²=0.00), described by the author as “hardly any evidence” of the conventional relationship (Fed FEDS Notes, Emre Yoldas, 10 May 2024).
The advanced-foreign-economy subsample flips it: a 2022 slope of 1.69 (p=0.00, R²=0.26), and 2023 at 6.97 (p=0.00, R²=0.53). Same study, opposite conclusions depending on the slice. That is the case for a composite index: when one input goes quiet, the others still carry information.
Treat it as confirmation, not a trigger. Agreement with Step 1 gives you a thesis; disagreement gives you a smaller position or none. And when the inputs disagree with each other, that is information, not noise. It usually means you are early in a regime change, which is exactly when a single-input read is most dangerous.
Your move: compare the composite index reading against your Step 1 sentence. Disagreement means you write down which input you are overriding and why. If you cannot name it, skip the trade.
Below we can check the composite index for the EUR/USD, which has contributions from Germany 10Y – USA 10Y government yield spread, gold (mainly affects the USD) and Germany/USA stock market price ratio:
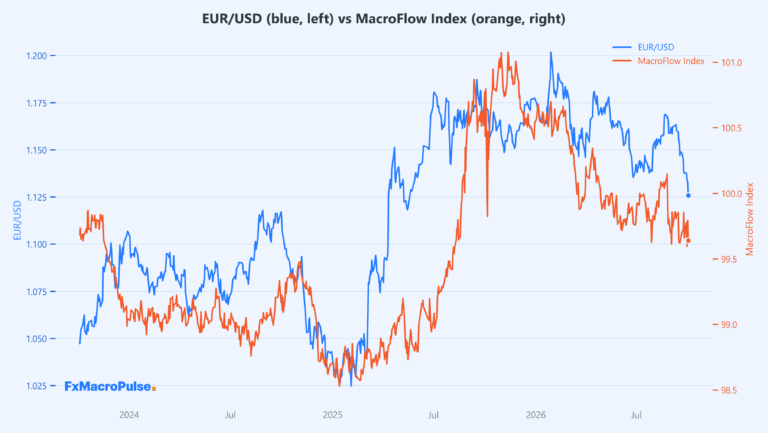
MacroPulse composite index — EUR/USD
Step 3: who is already positioned against you? Check COT
The Commitment of Traders report is a positioning snapshot, not a forecast. Use it to find out whether you are joining a crowd already fully invested in your idea.
It is published by the US Commodity Futures Trading Commission, weekly, released each Friday at 3:30 p.m. ET, covering positions as of the preceding Tuesday (WSJ). That lag is both the point and the limitation. It tells you what large, reportable participants held before you decided anything.
Crowding matters because the carry trade—using borrowed money to profit from interest rate differences—gives you small, steady gains while exposing you to massive, sudden losses.
A famous lecture from Gresham College explains this risk with two simple pictures:
- The Escalator: You make money slowly, taking the stairs up one step at a time, but when things go wrong, you drop fast on a down escalator.
- The Steamroller: It is like picking up nickels in front of a steamroller—you keep making small profits until you get crushed.
(Gresham College, Prof. Jagjit Chadha, 4 Feb 2016).
So if Steps 1 and 2 point long the high-yielder and COT shows net positioning already at a multi-month extreme in that direction, you are buying the carry late. The trade can still work. But the exit is crowded, and crowded exits move fast.
Your move: pull the COT positioning chart for your pair. If it’s extreme and in your direction, enter the trade half size, with a wider stop, or a different entry.
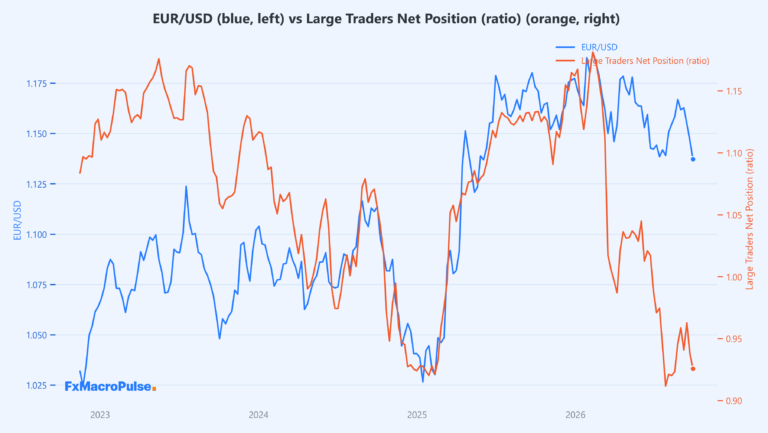
COT/TFF positioning — EUR/USD
Step 4: what do the central banks actually want?
Read the two central banks side by side and ask what each is trying to achieve. Rate differentials follow intent, and intent changes before rates do.
Official sources are clear on the intent function. The Federal Reserve’s FAQ on why interest rates matter explains that the Fed raises rates to slow economic activity and bring inflation down, which is why a hiking cycle exists (Federal Reserve). A policy statement describes what the committee wants the economy to do, and therefore where rates are likely to go next.
For each central bank, check for three factors:
- Direction of travel: Is the central bank hiking, holding, or cutting? The direction moves the spread—the current rate level doesn’t.
- The stated condition: Track the specific metric they care about (like inflation, jobs, or growth) instead of calendar meeting dates.
- Pushback language: When a central bank publicly fights what the market is pricing in, the market usually gives way eventually.
The best long-term macro trade happens when one central bank is ending its policy cycle while the other is just starting. If both banks are moving in the same direction, the macro driver is weak—regardless of what the yield chart looks like.
One trap worth naming: hawkish does not reliably mean stronger. The same 2024 Fed note found that even when an advanced-economy currency’s policy expectations fully match US expectations, that currency “is expected to depreciate about 7 percent against the dollar,” which the author suggests may reflect “the safe-haven role of the dollar” (Fed FEDS Notes, Yoldas, 10 May 2024). Relative policy is one input. Haven demand is another, and it can override the first.
Your move: keep both central banks’ most recent statements open at the same time so you read them as a pair. Write down each side’s direction of travel and the condition attached to its next move. And of course, they should be relatively recent reports.
Step 5: what could break the thesis?
Screen geopolitical risk specific to your pair. Generic macro warnings are useless, because the same event strengthens one currency and wrecks another.
The IMF’s April 2025 Global Financial Stability Report finds that major geopolitical risk events can trigger a significant decline in stock prices and raise sovereign risk premiums, with military conflicts having a disproportionate and more persistent effect (IMF, Global Financial Stability Report, April 2025). To track this quantitatively, the Caldara and Iacoviello Geopolitical Risk Index, developed at the Federal Reserve Board, measures adverse geopolitical events from newspaper coverage globally and for individual countries (Geopolitical Risk Index).
Run these three quick checks on your currency pair:
- Is either currency used for funding? Funding currencies (i.e. very low interest rate currencies that are used to fund investments in other countries) spike when risk appetite drops because traders dump carry trades and buy back the borrowed currency.
- Does either country export commodities? If so, supply shocks in that commodity drive the currency more than overall market sentiment.
- Do traders treat either currency as a safe haven? Haven demand regularly beats interest rate gaps—just like the US dollar shows during major panics.
This step is last because it generates no trades: it just tells you whether the trade you already found can “survive” a less favorable news headline.
The full walkthrough: five steps on EUR/USD
Here is the whole sequence run on one pair, in order.
Step 1, capital flow. Pull the EUR/USD 10-year yield spread chart. The question is not whether the spread is wide in absolute terms, but whether it is trending toward the dollar or the euro, and whether that move is accelerating. A spread narrowing while EUR/USD falls is a divergence worth noting, because it usually resolves one way or the other.
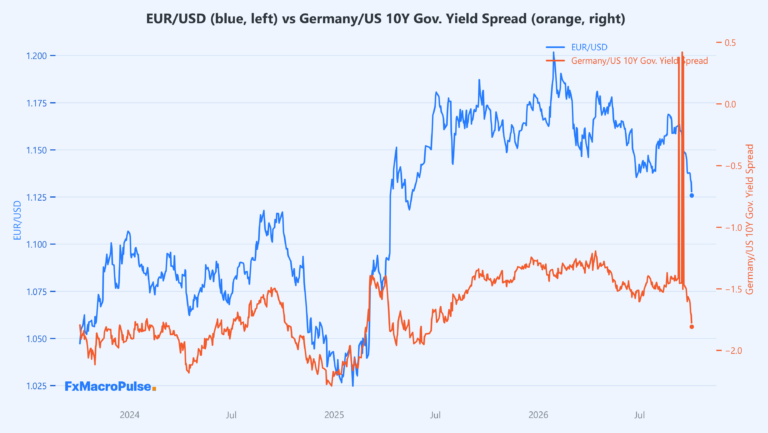
10-year government yields spread — EUR/USD
Step 2, composite index confirmation. Compare the spread read against the MacroPulse composite index for EUR/USD (this index takes into account yield spreads, correlated commodities and stock prices in both countries), which folds in the correlated cross-asset moves. Same direction means the flow story holds. A flat composite against a trending spread means the story is unresolved.
Step 3, positioning. Check the EUR/USD COT positioning chart. Net positioning already stretched in your direction means you need a wider buffer than normal. Flat positioning, or leaning the other way, means you are trading with room behind you.
Step 4, central banks. Read the ECB and the Fed side by side and ask which one’s next move is more conditional. A pair where one side is committed and the other is data-dependent produces the cleanest divergence trades, because the market can price the committed side without waiting.
Step 5, risk screen. How does a hostile headline hit this trade? If you are long the euro, a risk-off shock deals a double blow: it triggers funding outflows and dampens growth expectations. But if you are long the dollar, you hold a safe-haven asset: this means that the fundamental yield differential, which usually drives standard currency valuations, is temporarily ignored by the market.
Frequently asked questions
What is forex macro analysis?
It is the practice of evaluating the two economies behind a currency pair before trading it, using inputs such as interest rate spreads, central bank policy, inflation and capital flows. The Central Bank of Iceland lists foreign trade, terms of trade, commodity prices, interest rate spreads and inflation as the long-term exchange-rate drivers (Central Bank of Iceland).
What is a yield spread in Forex?
It is the difference between two countries’ bond yields (government bonds are commonly used for this purpose), such as US Treasury yields minus German Bund yields. The Corporate Finance Institute defines the net interest rate differential as “a difference in interest rates between two countries or regions” (Corporate Finance Institute).
Do bond yields lead currency prices?
Not always, and the relationship is regime-dependent. An ECB speech recorded a 2-year rate differential versus EUR/USD correlation of 0.85 from 2005 to 2011 (ECB, Cœuré, 3 Nov 2017), while a 2024 Fed note found “hardly any evidence” of a systemic relationship over 2021 to 2023 (Fed FEDS Notes, Yoldas, 10 May 2024).
Is the COT report a leading indicator?
No. It is a positioning snapshot with a built-in delay, published by the CFTC each Friday at 3:30 p.m. ET covering positions as of the preceding Tuesday (WSJ). That delay makes it useful for spotting crowded trades rather than predicting direction, which is exactly how Step 3 uses it.
What is the uncovered interest rate parity puzzle?
It’s the contradiction where high-interest-rate currencies consistently outperform low-interest ones, instead of falling in value to offset the rate gap like economic theory says they should. Gresham College’s carry trade lecture breaks down this exact mismatch and the massive downside risk it hides. In other words, high-yield currencies tend to appreciate or stay strong in normal conditions. Capital flows into the higher rate, chasing yield and driving the currency up, creating free-looking excess returns (Gresham College, 4 Feb 2016).
About the Author
 I’m Sam Hayes, a market analyst hailing from London with 10 years of experience covering macroeconomics, central bank policy, and G10 currency flows. After earning a degree in Economics from the University of Bristol, I began my career as a junior risk analyst at a London-based prop firm before moving to an institutional FX research desk in the heart of London.
In my articles, I focus on breaking down complex macro drivers—like yield differentials and risk sentiment—into clear, practical insights that you can apply directly to your trading.