Macro Analysis
EUR/USD ended at 1.16023 on Sep 11. It slipped from 1.16339 on Sep 10 and 1.16274 on Sep 9. The September range is tight: roughly 1.15853 to 1.16339. Daily momentum looks mildly bearish inside that range. On the weekly chart, EUR/USD still shows lower highs since the January peak at 1.20176. It made lower highs at 1.19041 in February, 1.18092 in April, and 1.16878 in August. The pair holds above the June–July lows near 1.1354–1.1384, so the weekly picture is rangebound with weak upside momentum.
The MacroFlow Index ended at 100.186 on Sep 11. It fell from 100.484 on Sep 1 and 100.328 on Sep 9. The index remains above 100 but below the August high of 100.559. In September, EUR/USD and MacroFlow both moved lower. That is convergence, and it suggests the macro backdrop supports the pair’s recent pullback.
Earlier moves showed divergence. In July, EUR/USD rose from 1.14133 on Jul 1 to 1.15235 on Jul 31, while MacroFlow slipped from 100.251 to 100.203. In early August, EUR/USD rose again while MacroFlow fell to 100.066 on Aug 4. Those divergences showed the pair’s rally lacked macro confirmation. Later in August, both rose together into Aug 21, then both turned lower. The current convergence lower is cleaner than the July divergence.
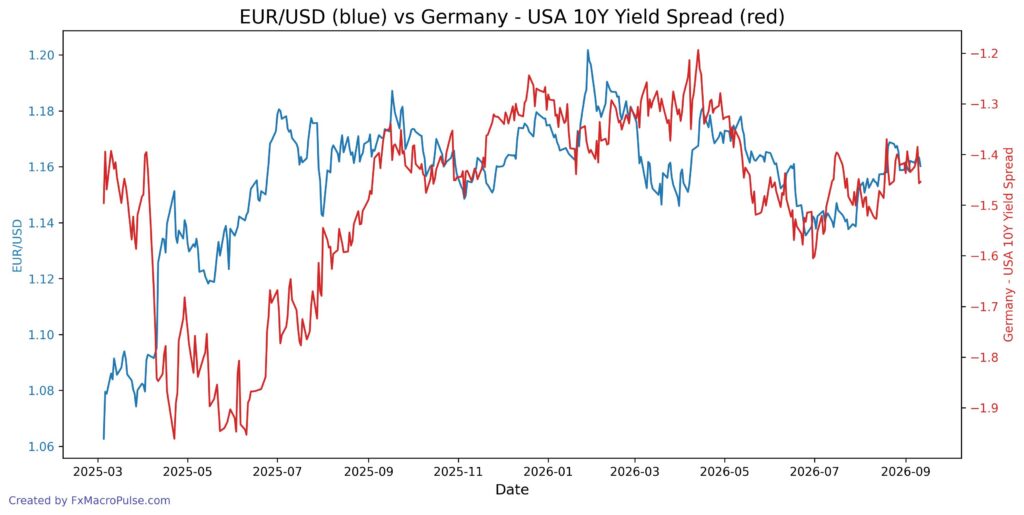
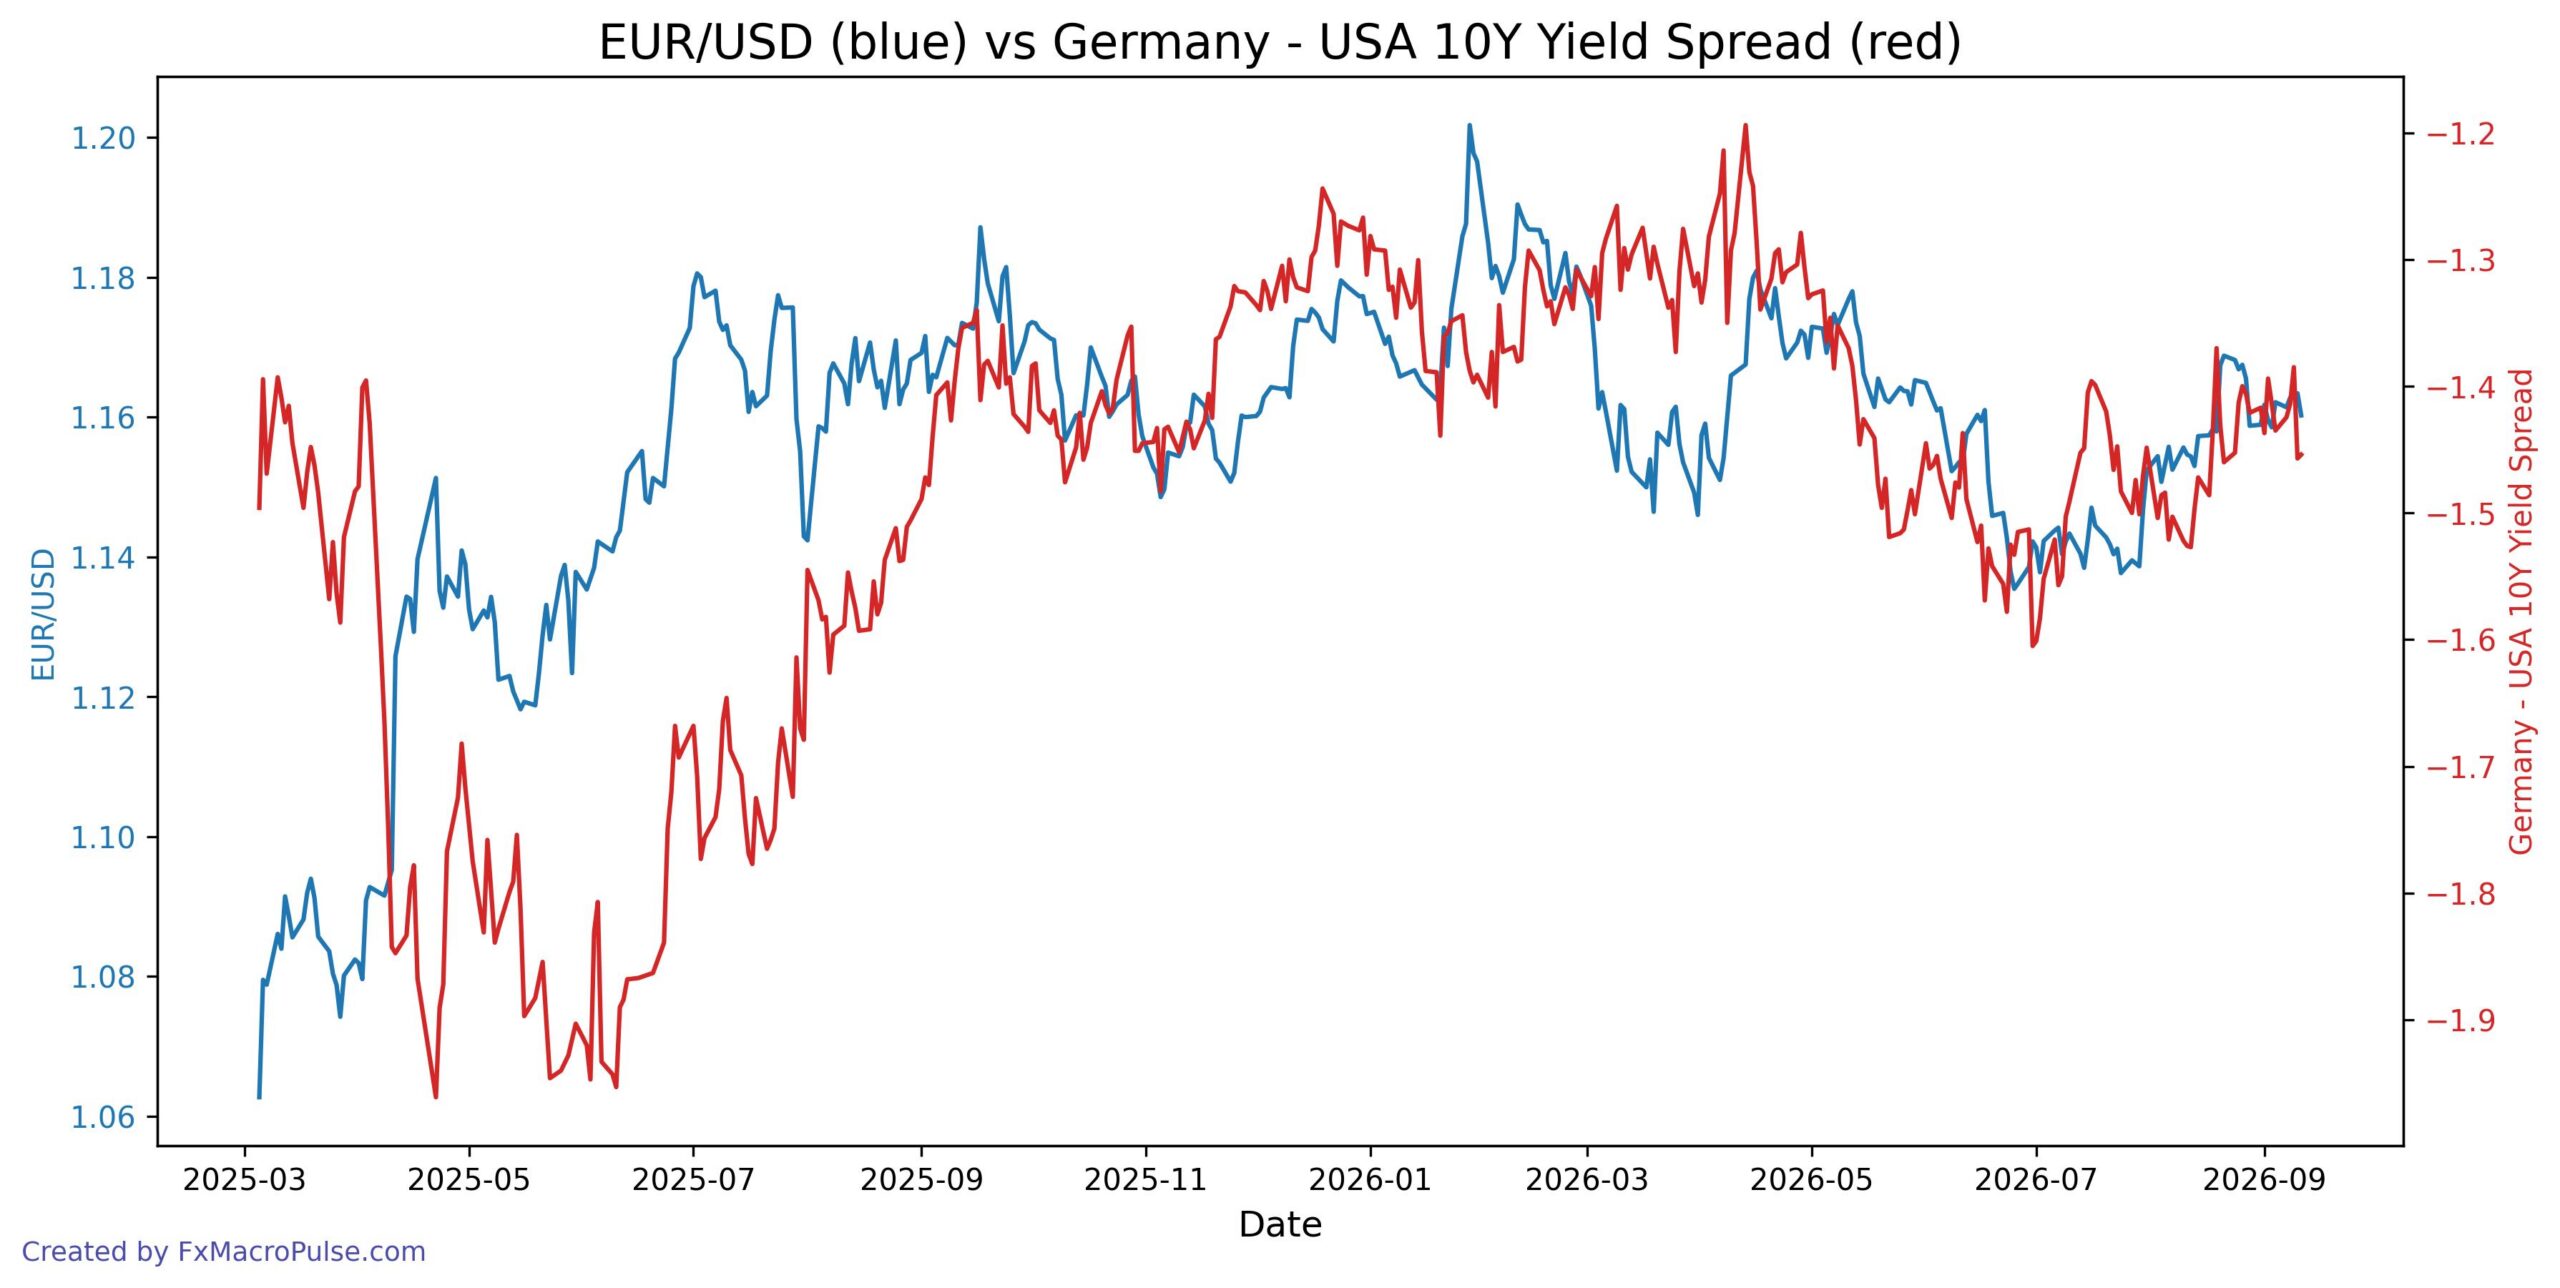
The Germany/US 10Y yield spread stays negative. On Sep 11 it was -1.454, compared with -1.385 on Sep 9. A more negative spread means German yields lag US yields. Because MacroFlow has a positive link to this spread, a wider negative spread weighs on the index and usually does not help EUR/USD. The spread is still much less negative than in early 2025, when it traded near -1.96, so the long-term headwind has eased. But the recent widening is a short-term caution for EUR bulls. The Germany/US stocks ratio and gold futures also feed the index; German stocks outperforming US stocks or gold rising would support MacroFlow.
Key daily levels for EUR/USD: support sits near 1.1585, then 1.1520. Resistance sits near 1.1635, then 1.1688 and 1.1700. A break below 1.1585 would point to 1.1520. A break above 1.1635 would open 1.1688. On the weekly chart, the pair remains in a wide 1.14–1.20 range. The 1.14 area has held since June, while 1.20 capped the pair in January.
Upcoming events can shift USD, yields, stocks, and gold, which feed into MacroFlow. ECB President Lagarde speaks on Sep 14 and Sep 18. US Core Retail Sales and Retail Sales come on Sep 16, with forecasts of 0.5% and 0.8%. The Federal Funds Rate decision also comes on Sep 16, with forecast at 4.00% versus previous 3.75%. FOMC projections, statement, and press conference follow. Philly Fed and Unemployment Claims come on Sep 17. Traders will watch whether these events widen or narrow the Germany/US yield spread. Stronger US data or a hawkish Fed tone could lift US yields, widen the negative spread, and pressure MacroFlow and EUR/USD. Softer US data or a dovish Fed tone could narrow the spread and support the pair. ECB comments can also move the euro directly.
Right now, EUR/USD and MacroFlow are converging lower. That keeps the short-term bias cautious for EUR/USD bulls. The weekly lower highs still show weak upside momentum. But with a moderate 0.45 correlation, the index does not drive every price move. Watch the yield spread and event risk for confirmation.
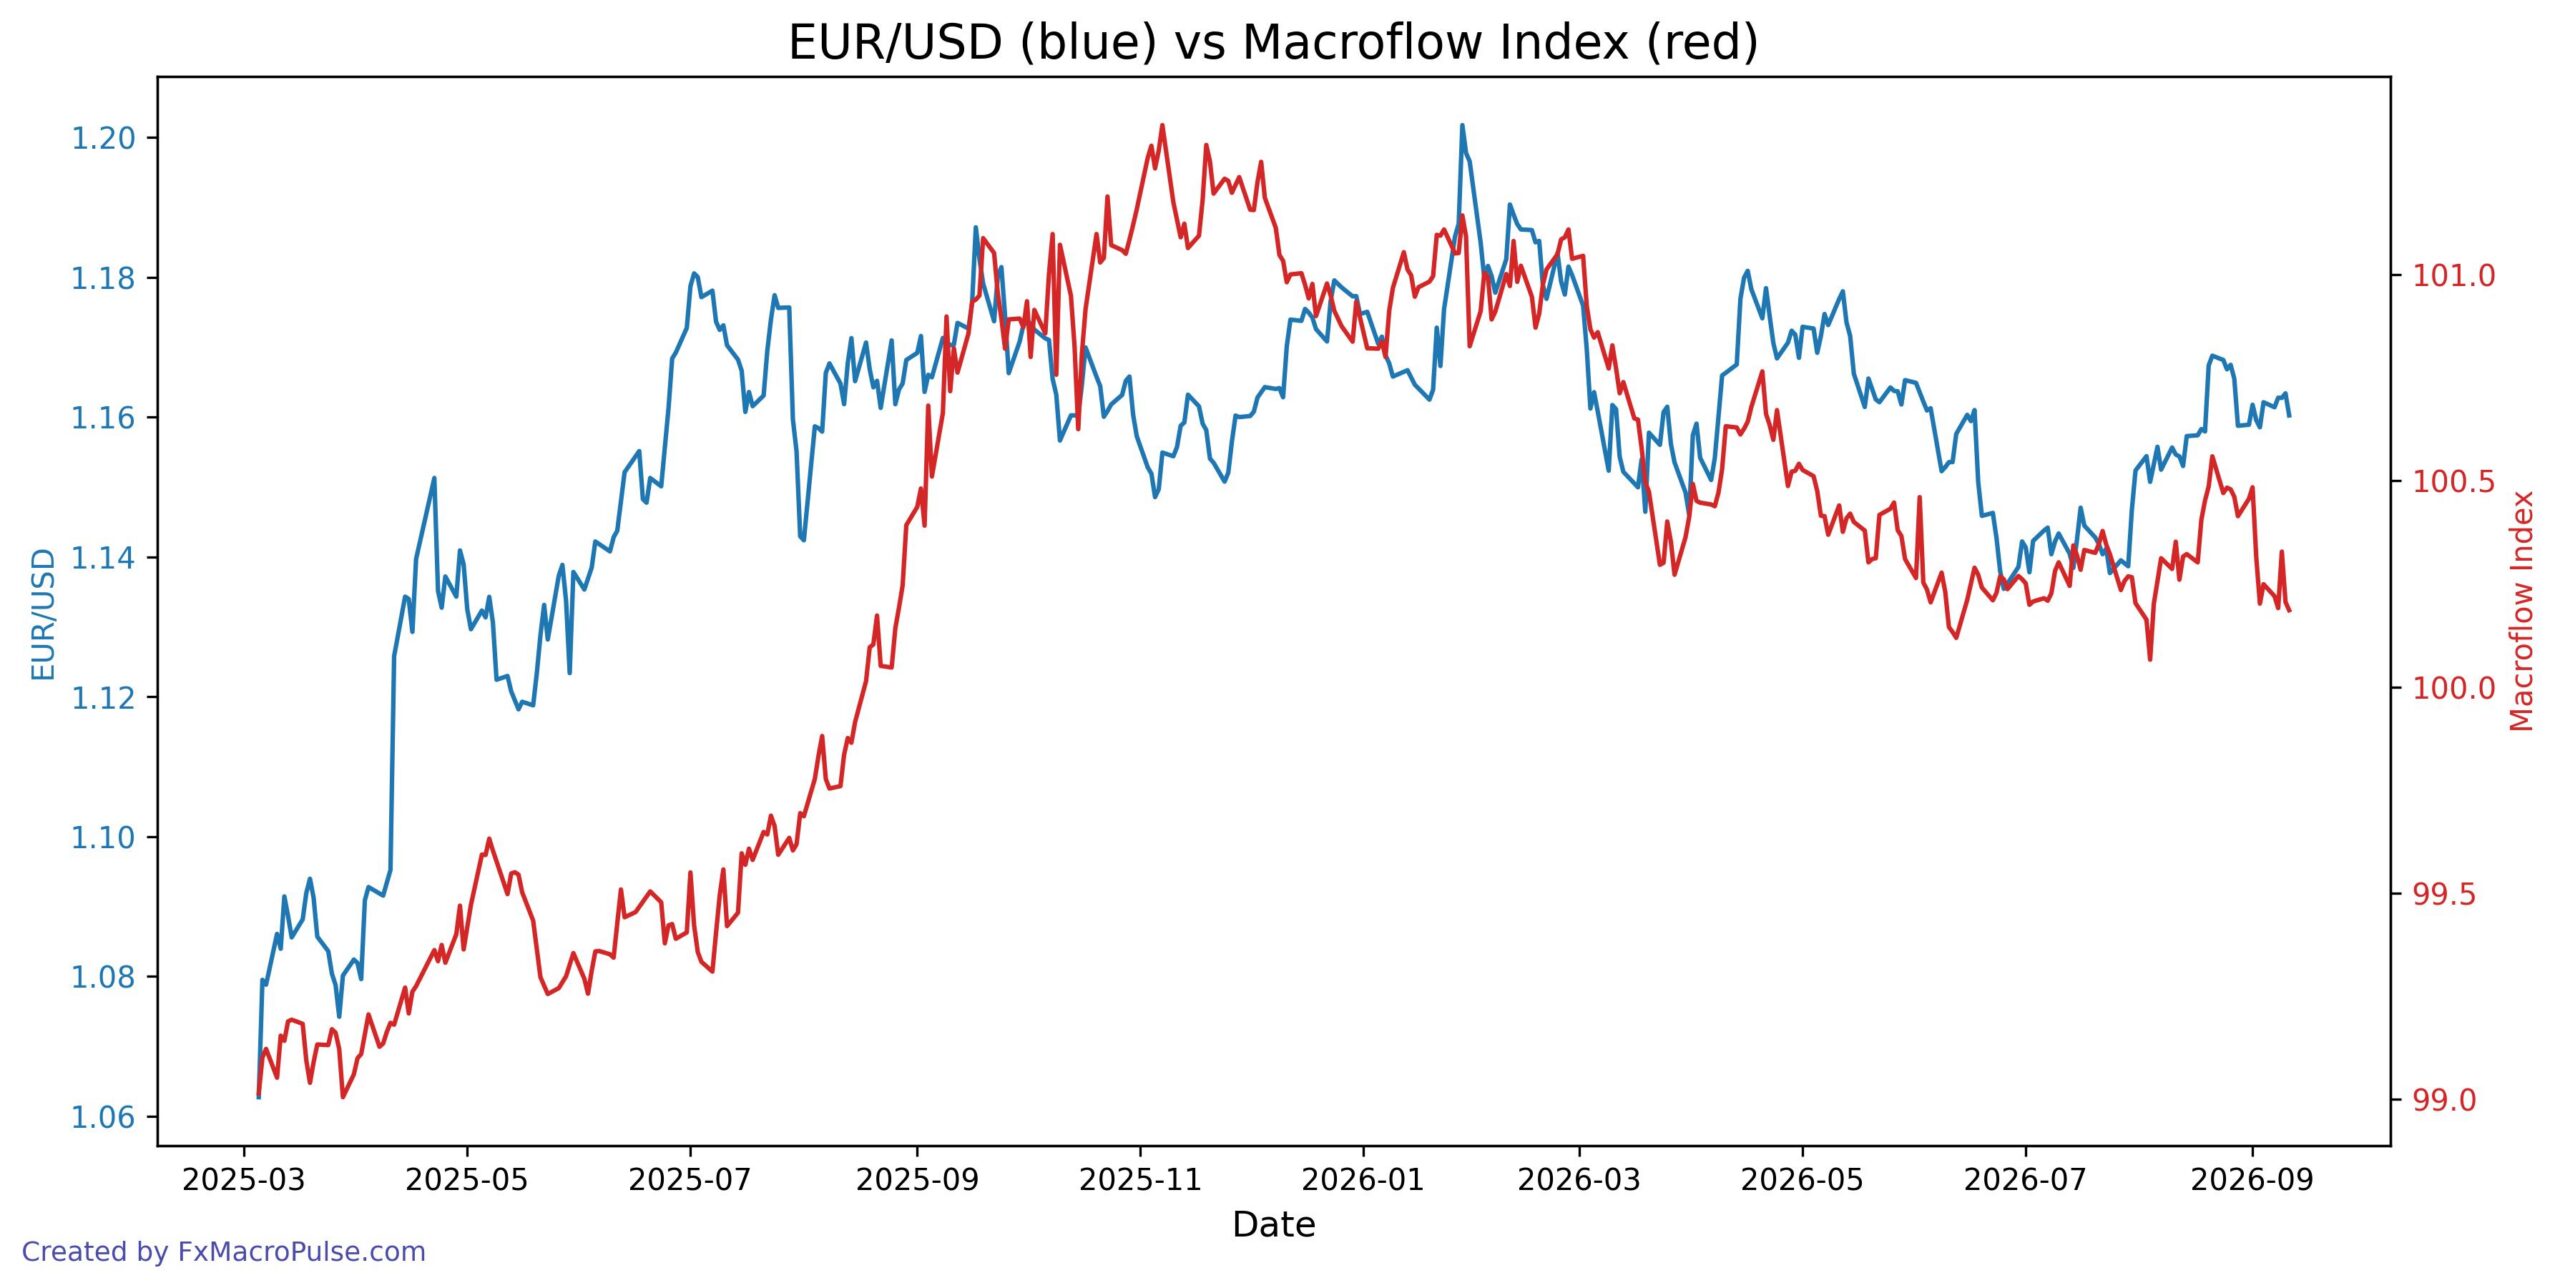
[The MacroFlow Index is a proprietary index created to track the pair’s fundamentals, and tracks the following: Germany/US 10Y Gov. Yield Spread, Germany/US Stocks Index Ratio, Gold Futures. It has a historical correlation of 0.45 with EUR/USD, so the pair and the index often move together, but the link is moderate. The index tends to rise when the Germany/US 10Y yield spread, Germany/US stocks ratio, and gold futures rise.]
COT Analysis
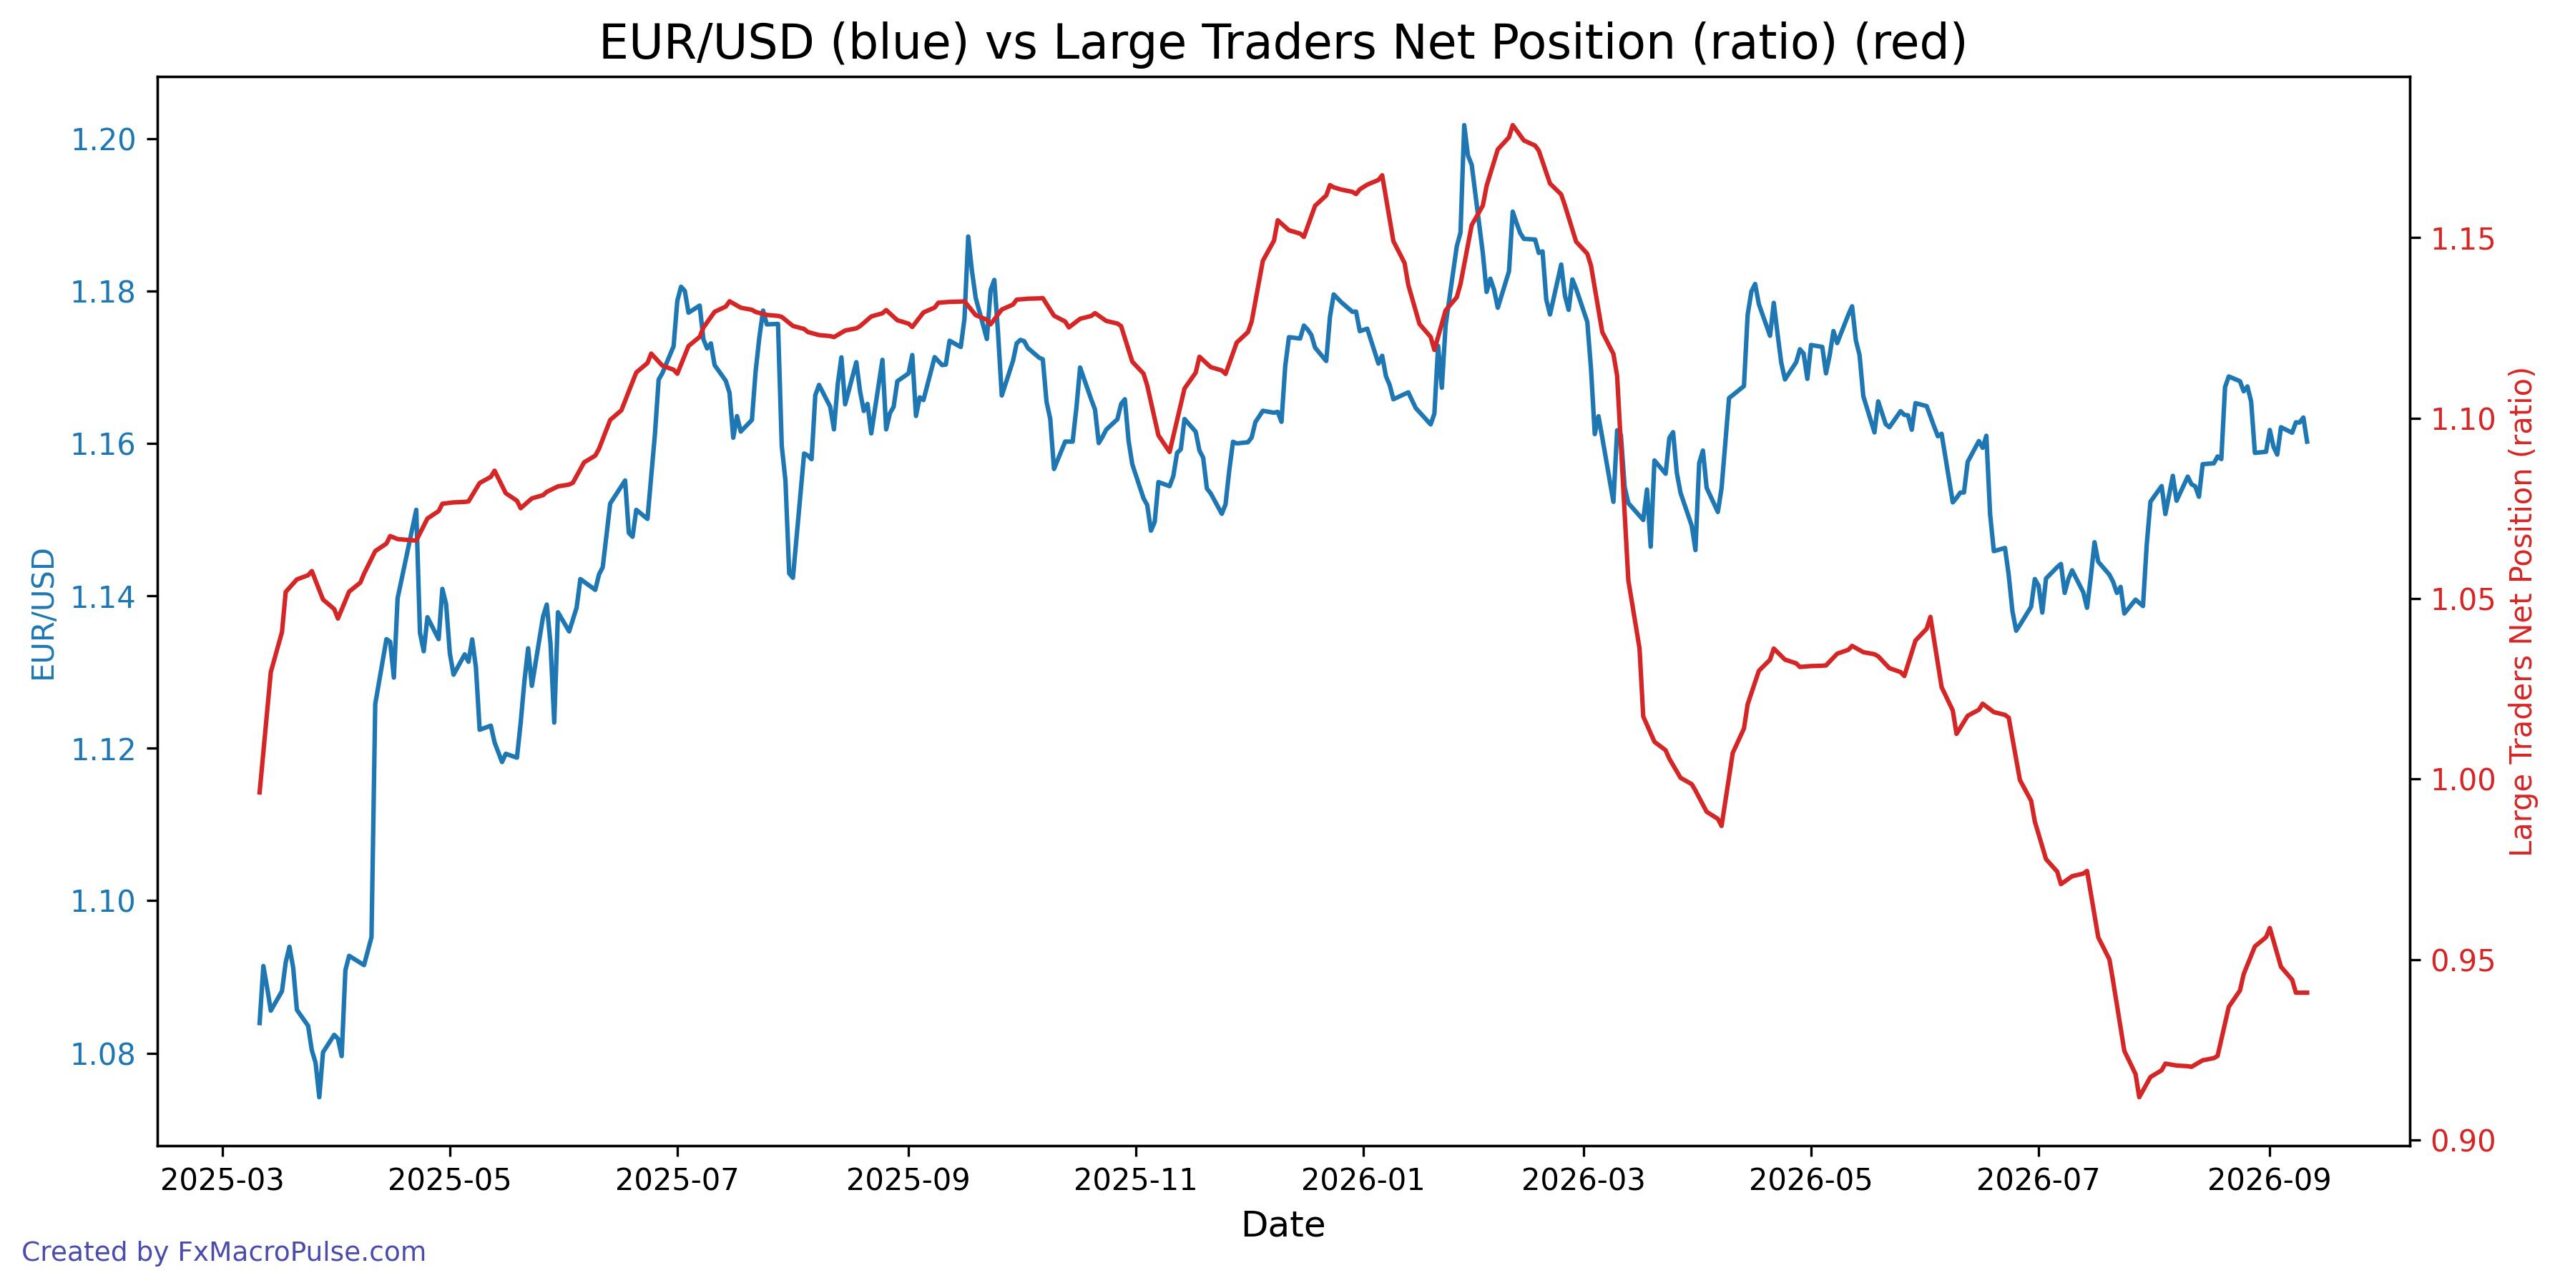
EUR/USD trades near 1.1600 in early September 2026, holding a 1.15–1.17 range on the daily and weekly charts after recovering from July lows near 1.14. The Large Traders Net Position ratio sits just below 1.00 at 0.9408, meaning large traders lean net short while price stays firm—a clear bearish COT divergence. Earlier in 2026, price and the ratio peaked together in late January/February and fell together into March, but since April the pair has often rallied even as the ratio dropped, so traders should watch whether price breaks the range or the ratio turns higher to confirm the next move.
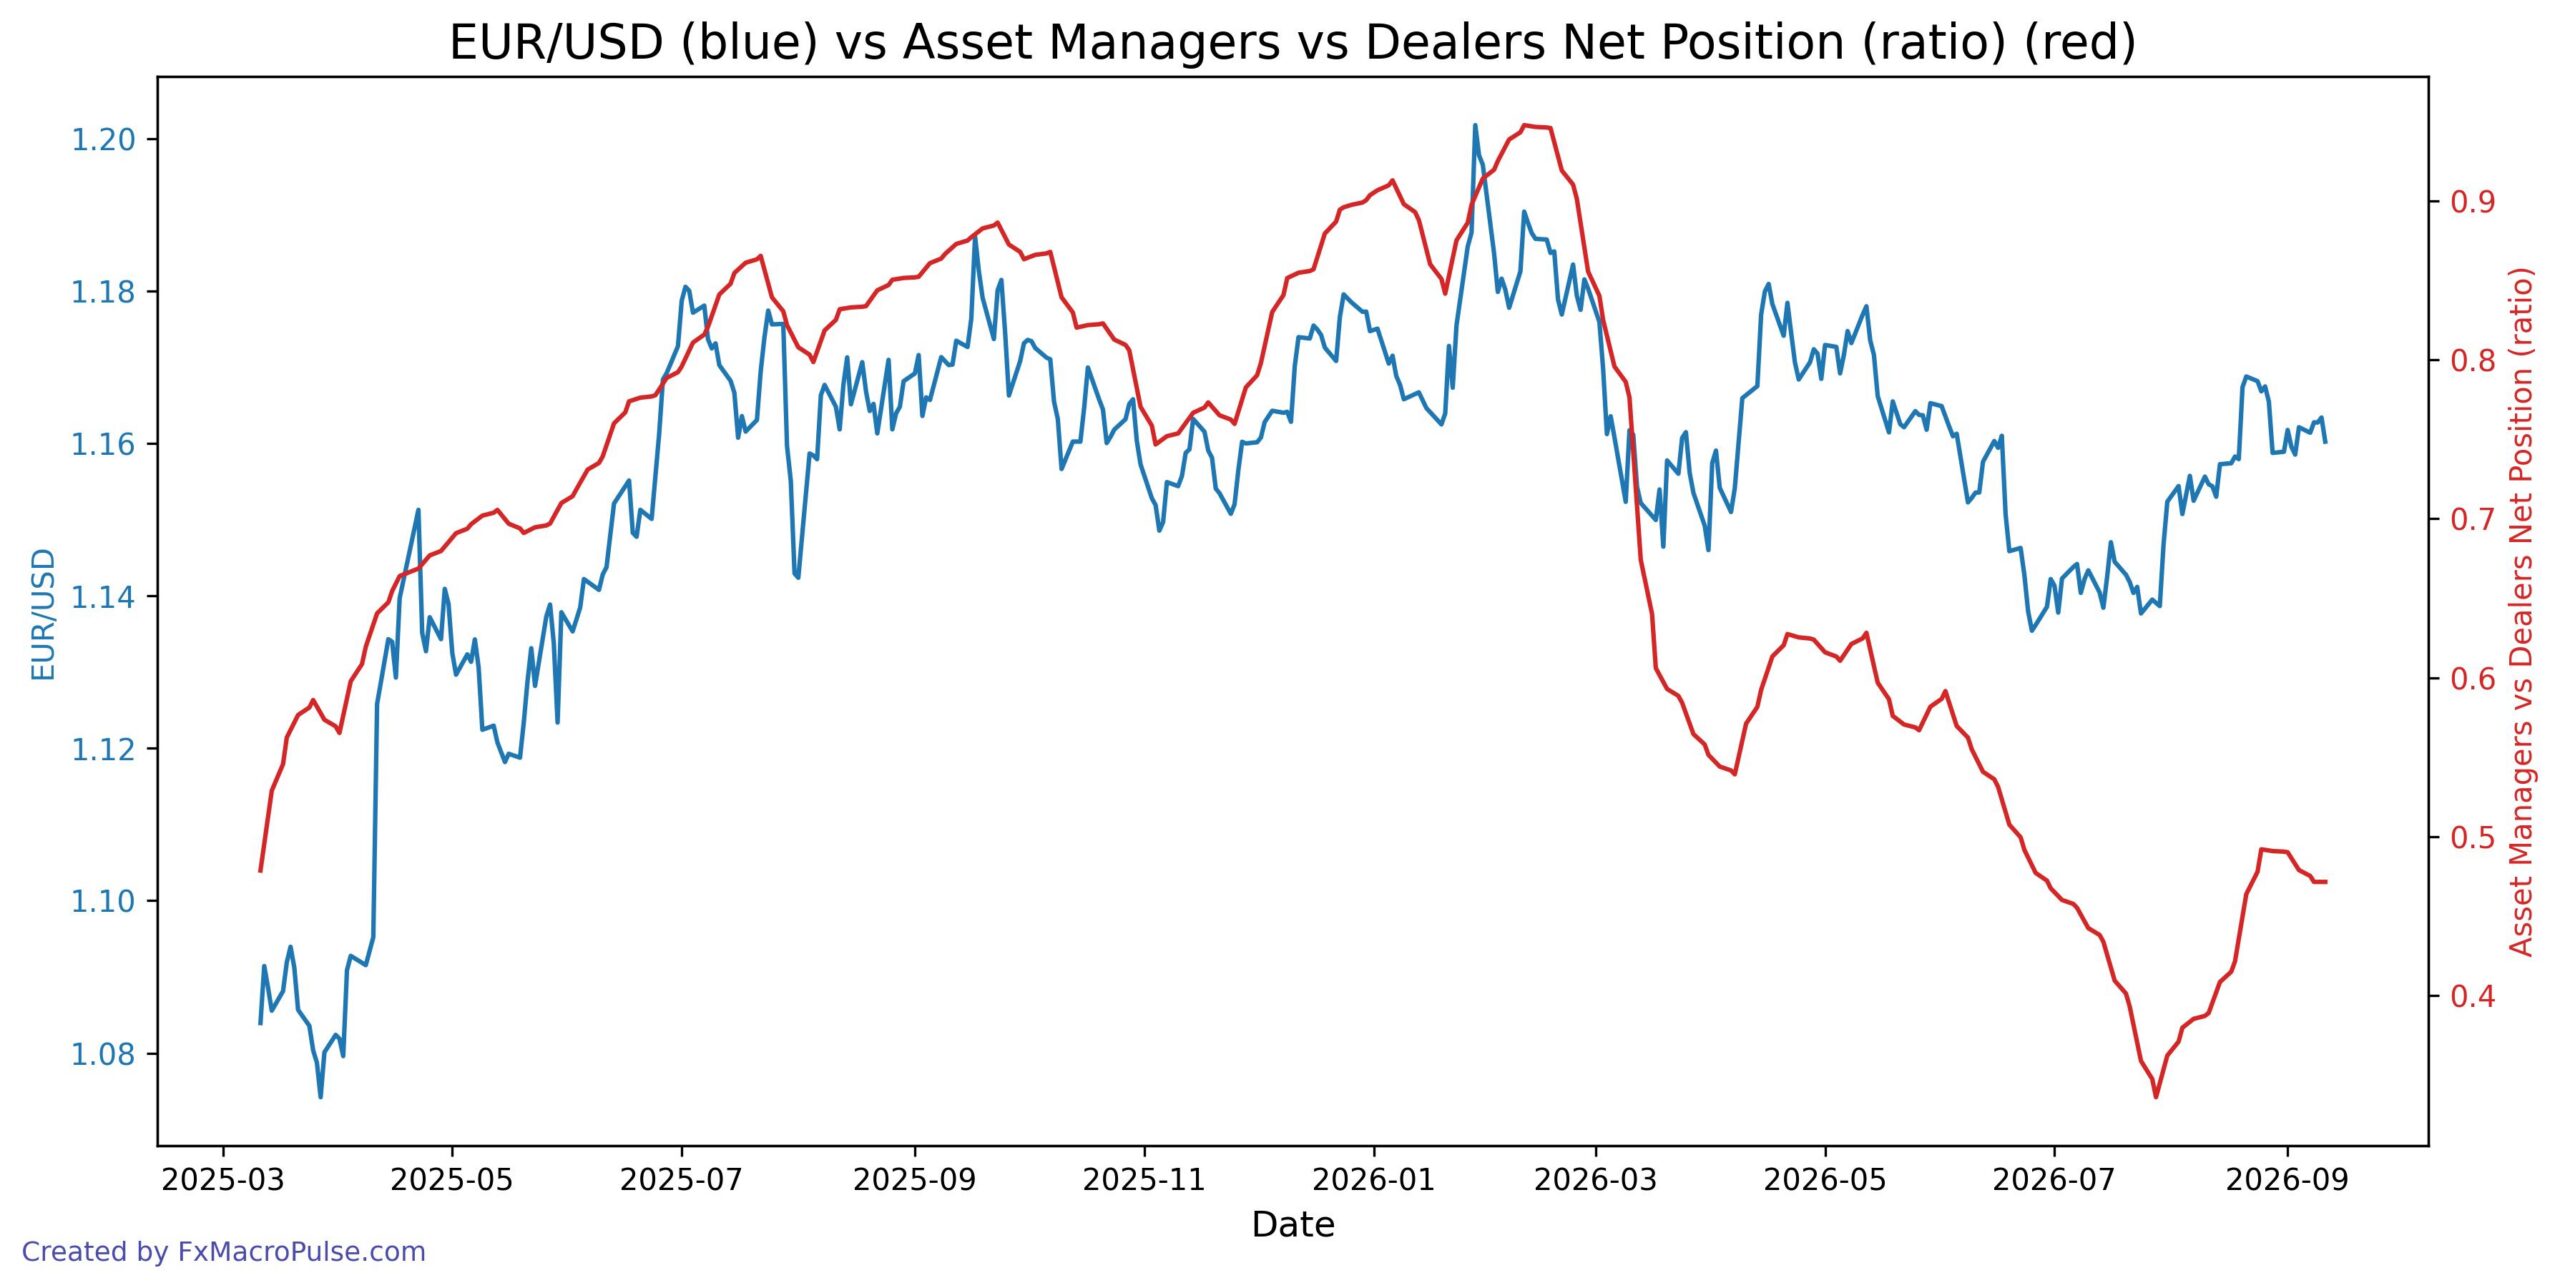
EUR/USD rose from around 1.1387 in late July to 1.1688 in late August and then eased to 1.1602, while the Asset Managers vs Dealers COT ratio climbed from 0.336 to 0.492 and recently held near 0.472. That shows convergence through late August, but a mild divergence since then as price cooled while the COT ratio stayed relatively high. On the daily and weekly charts, 1.1500 looks like near-term support and 1.1680–1.1700 like resistance, so traders can watch whether the COT ratio turns up again with price or keeps flattening. Macro attention remains on rate differentials and central-bank policy expectations, but the current mix suggests range conditions rather than a confirmed breakout.
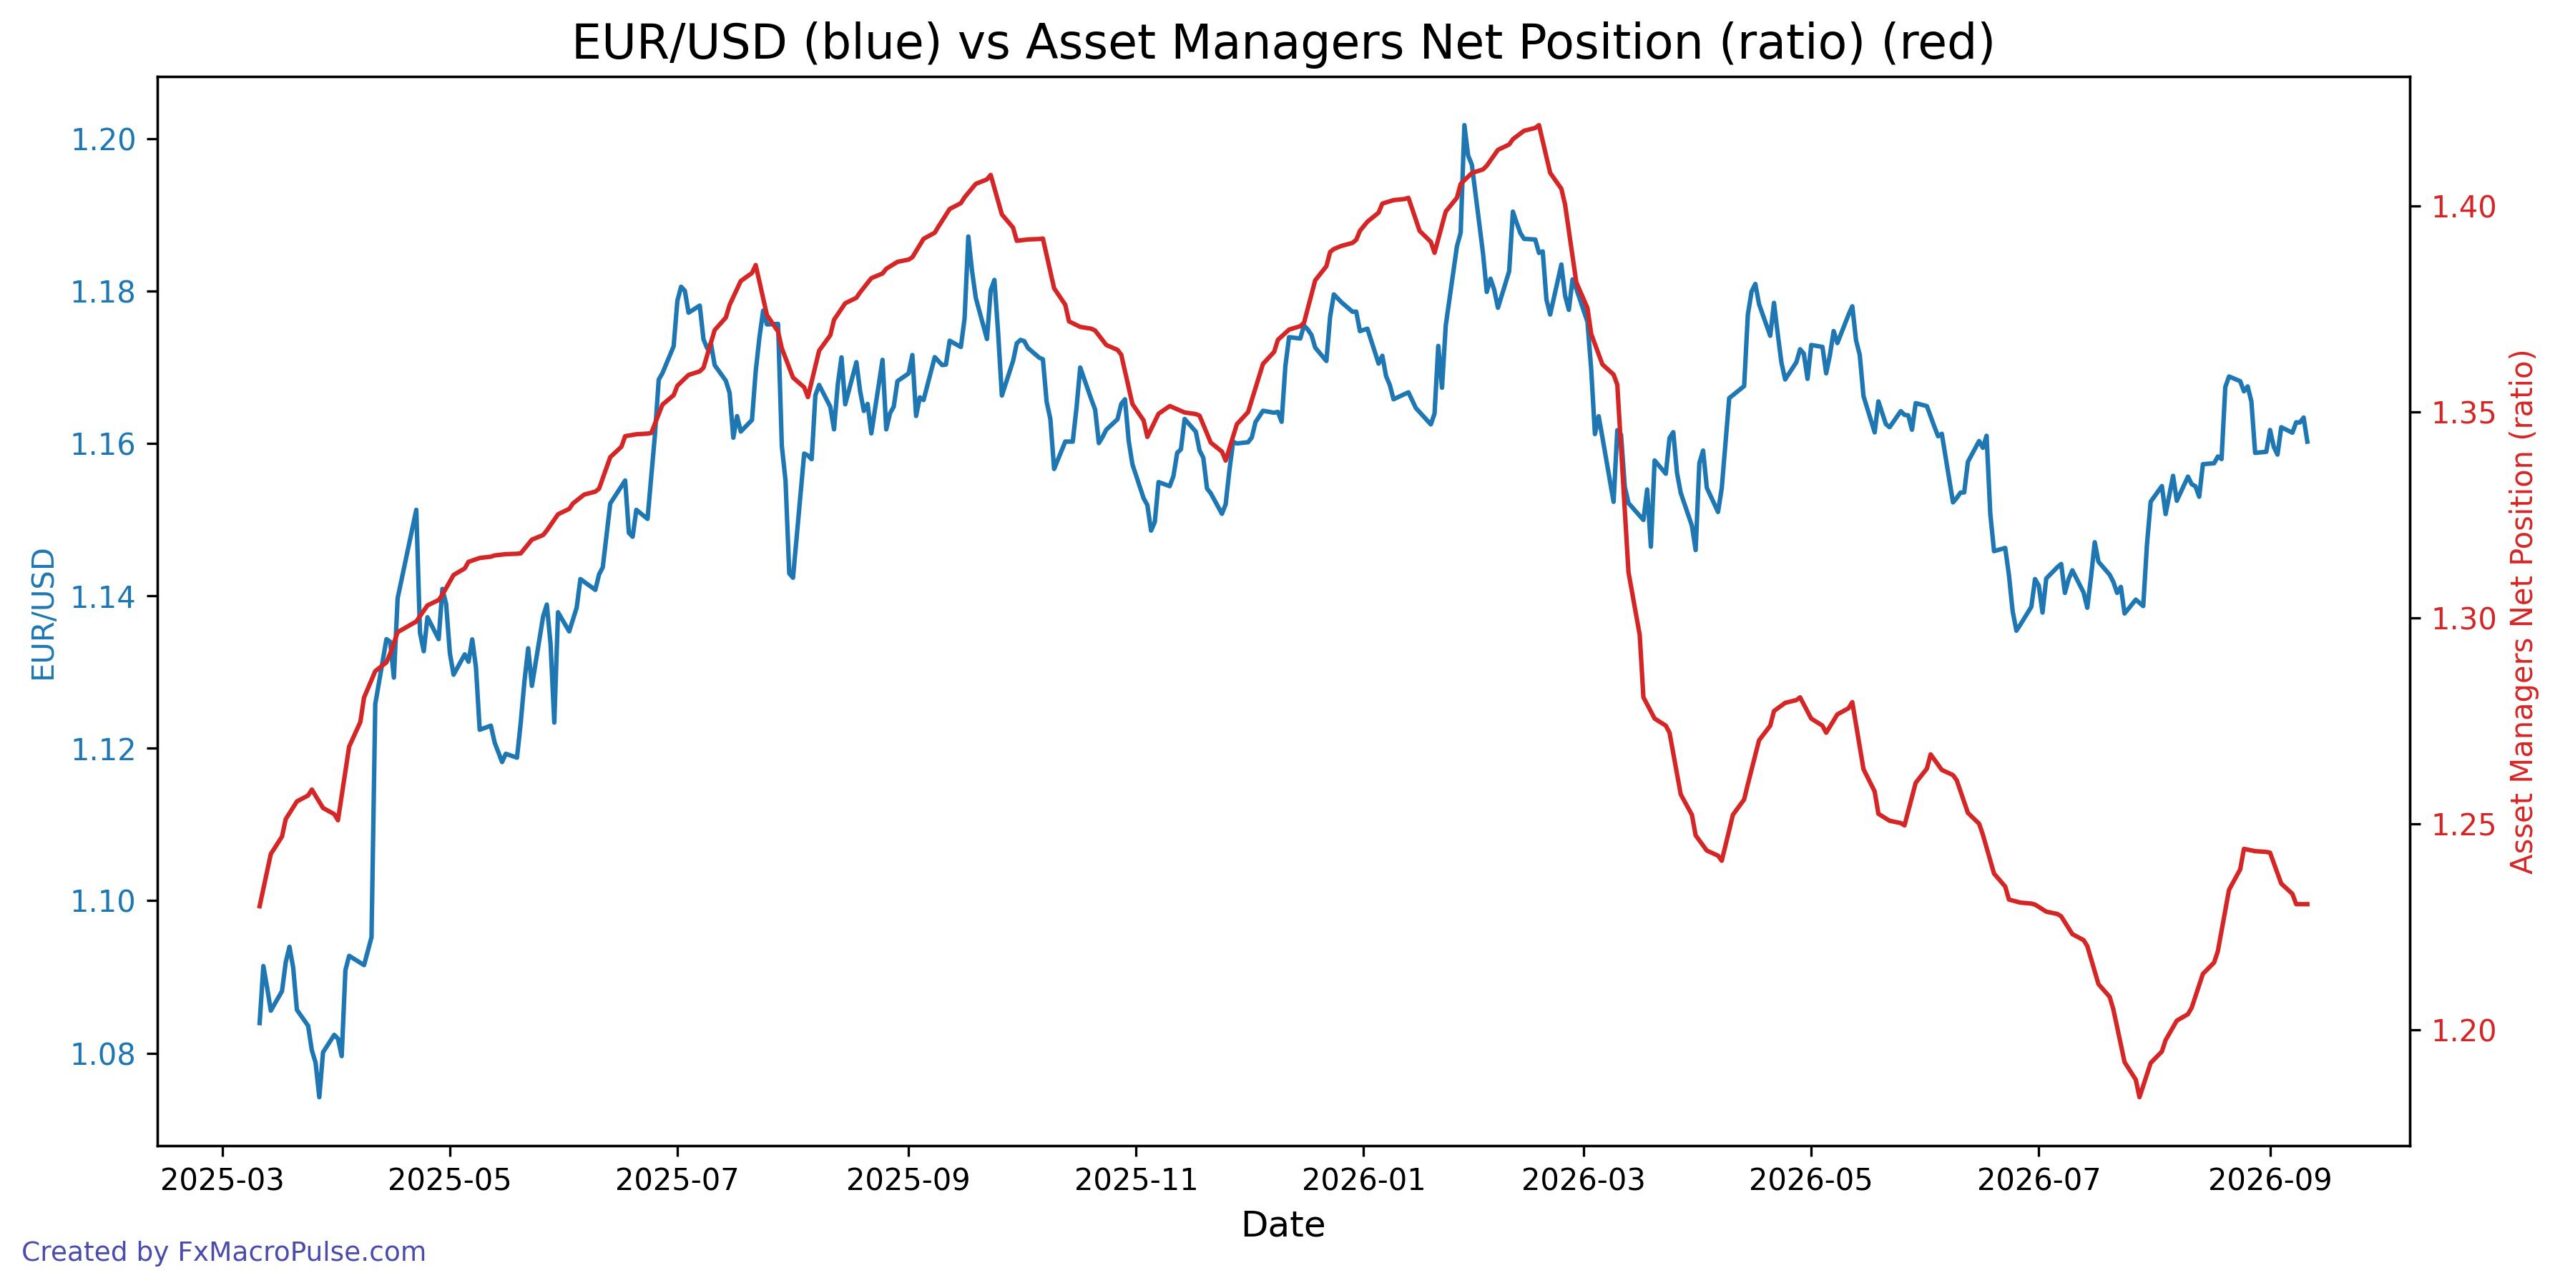
On the daily/weekly chart, EUR/USD is range-bound near 1.16 after a late-August bounce faded, while the Asset Managers Net Position ratio has flattened near 1.23 after peaking around 1.244 in August. The two have mostly converged since July: both rose into August and both softened into September, leaving asset managers net long EUR but far below the February 2026 extreme. This alignment points to steady but less aggressive euro bullish positioning rather than a major divergence. Traders may watch the 1.15–1.17 range, Fed/ECB policy expectations, and whether the COT ratio holds above 1.23 to see if price and positioning stay in sync.
News and Geopolitics
The dominant geopolitical force remains the U.S.-Iran confrontation and the closure of the Strait of Hormuz, an asymmetric energy shock that widens yield differentials in the dollar’s favor while weighing on European growth, inflation, and fiscal capacity. Trade-war escalation, transatlantic political fragmentation, and Russian hybrid warfare reinforce this dynamic, leaving EUR/USD with a bearish bias. That said, uncertainty is significant, as headline-driven swings around the October EU-China meeting, the Trump-Xi summit, or shifts in Fed rhetoric and Gulf shipping security could produce sharp reversals in either direction.