Macro Analysis
### USD/CHF: The Yield Spread Is Lying to You – Here’s What the Market Really Says
Price Action on the Daily: The pair launched a massive rally from the 0.763 low in late January 2026 to retest the 0.81 handle in June. But the move isn’t a straight line. After peaking near 0.8125 in late June, the pair pulled back to 0.807. We now see a tight consolidation between 0.795 and 0.810 for the past two weeks. This suggests indecision ahead of key U.S. labor data.
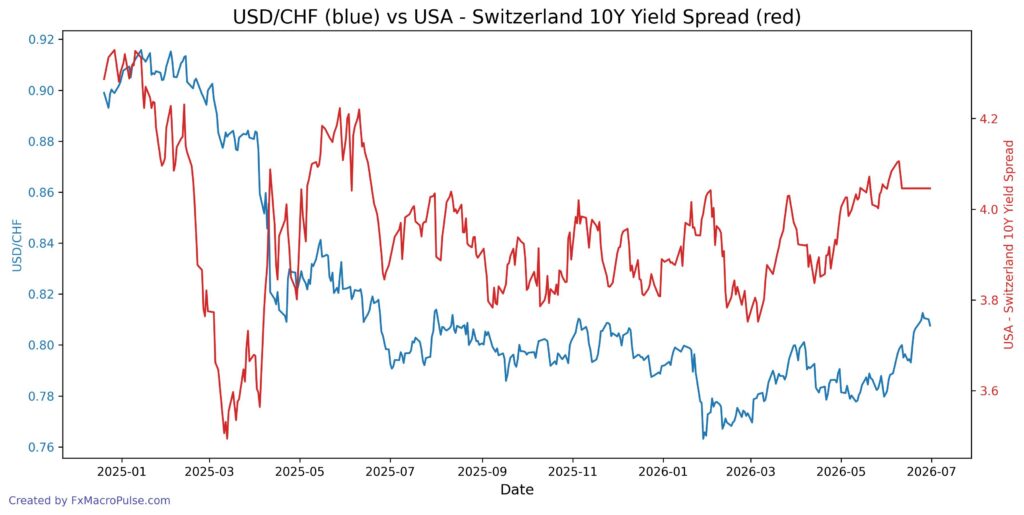
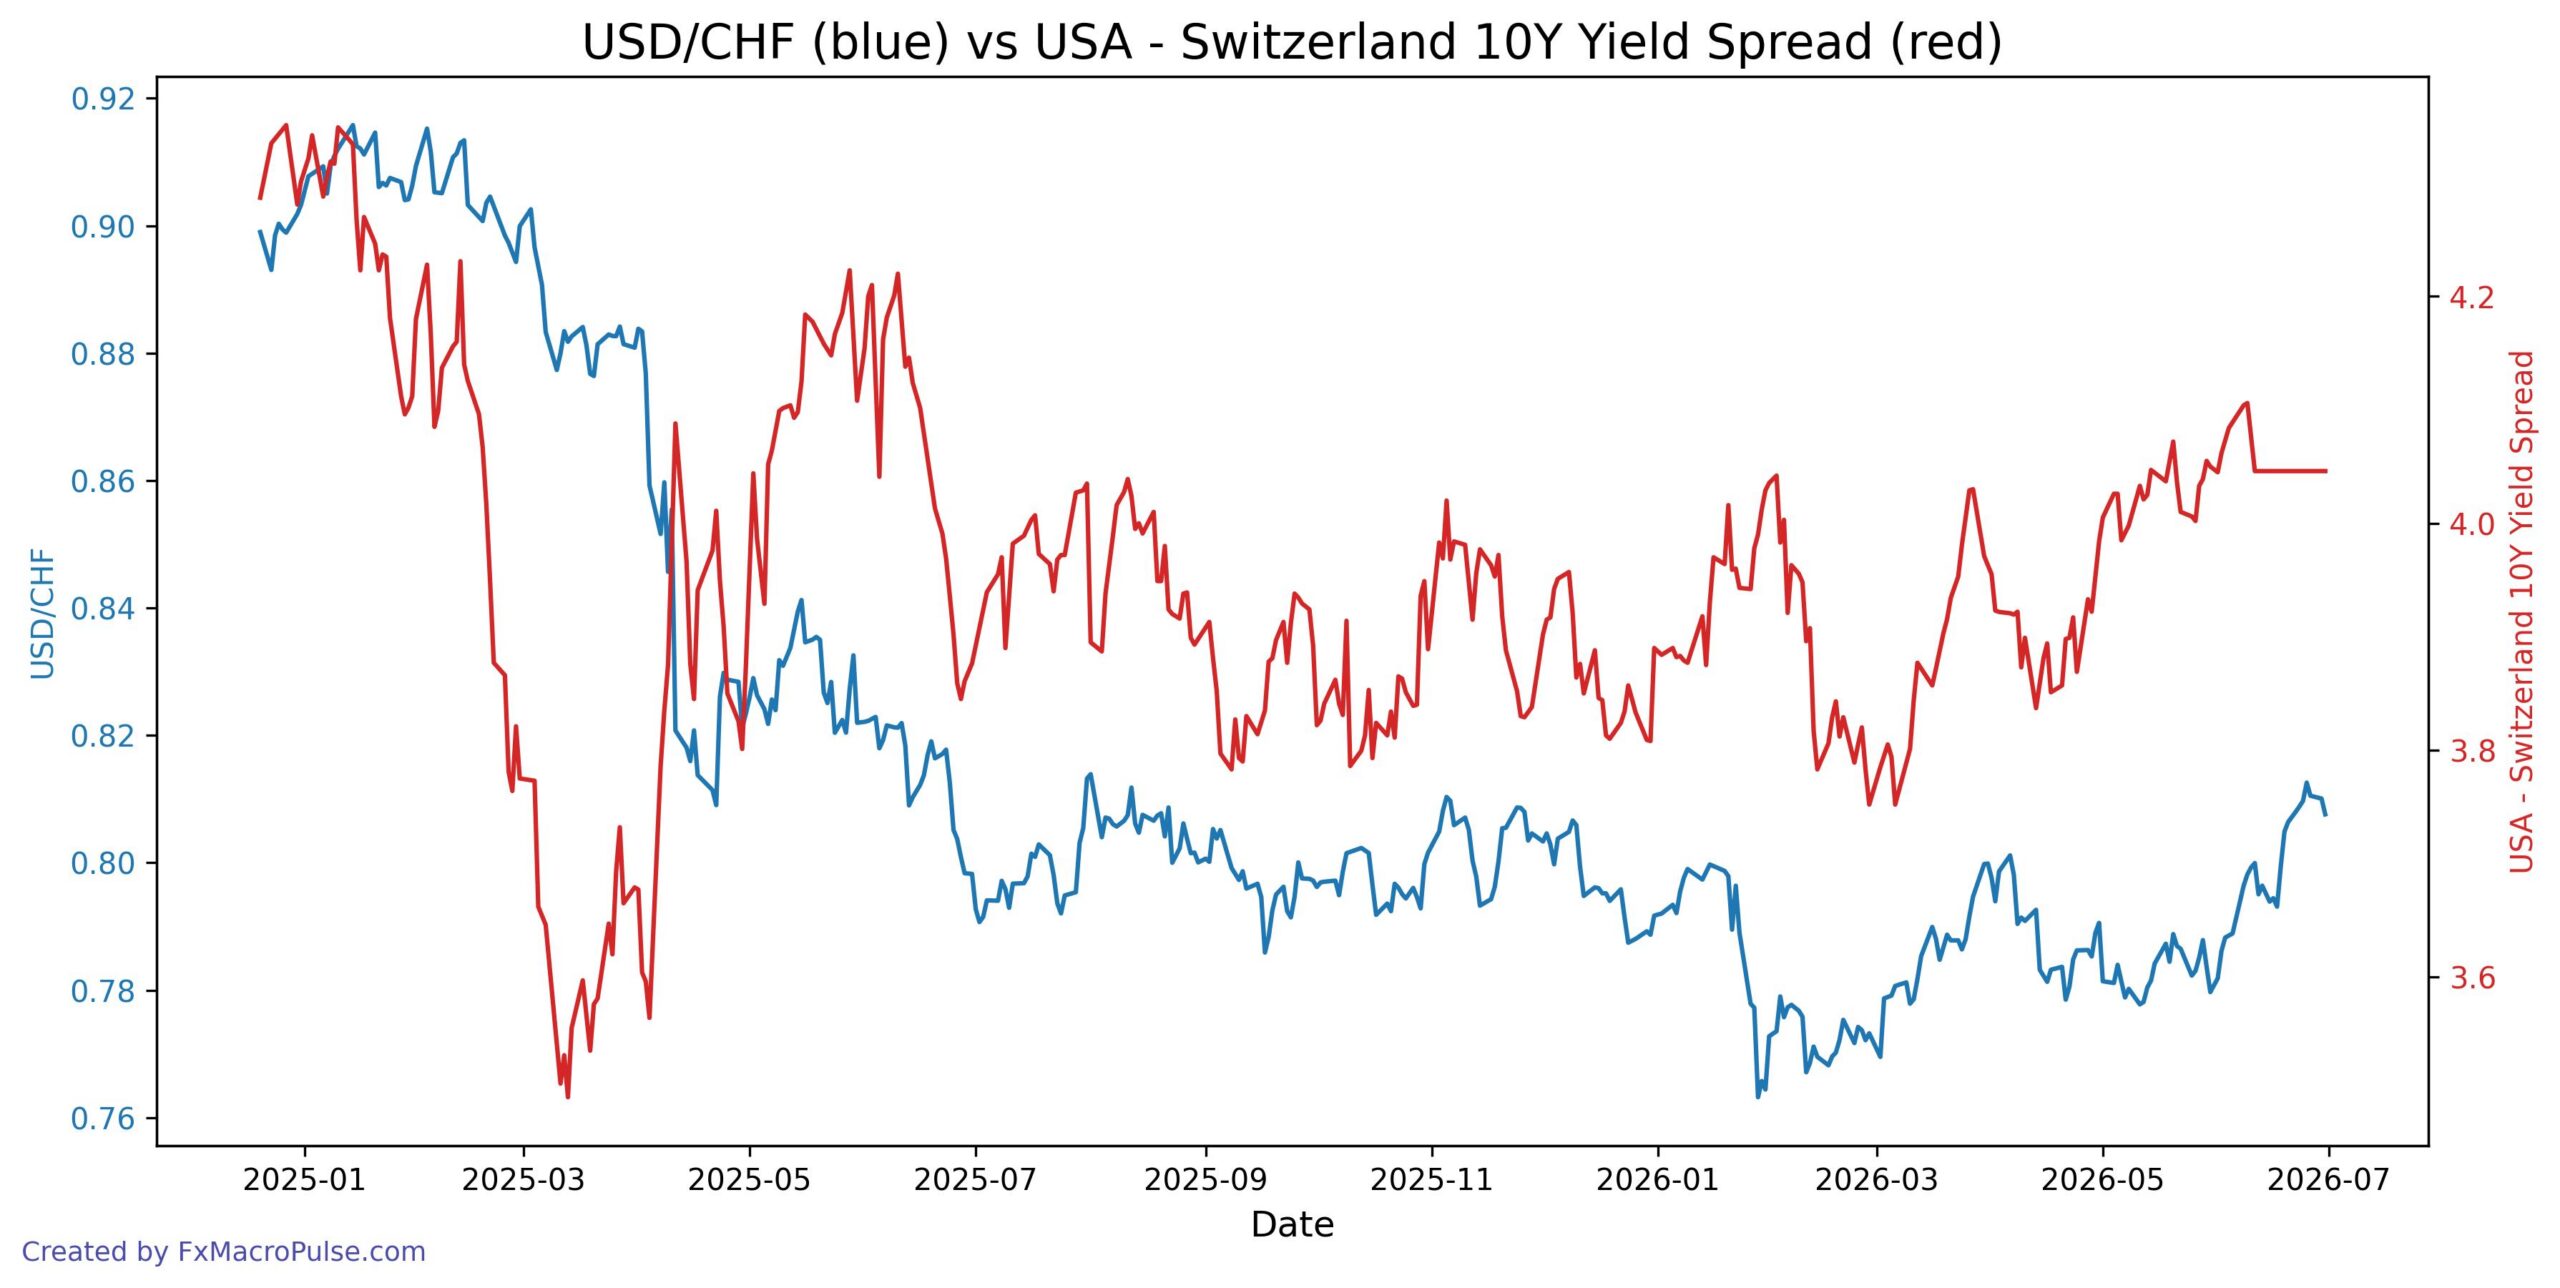
Correlation with Yield Spread? Forget It. The historical correlation of 0.07 means the USA–Switzerland 10-year yield difference explains almost nothing about USD/CHF moves. Look at January 2026: the yield spread actually rose from 3.83% to 4.03%, yet the pair crashed from 0.79 to 0.763. That’s a clear bearish divergence. Conversely, during the February–June recovery, the spread only climbed from 3.75% to 4.05%, while the pair surged 6%. The yield gap is not your driver here.
What Moves the Pair Now? The real force is risk sentiment and safe-haven flows. The Swiss franc gained sharply in late January as global trade fears spiked. When those fears eased, the franc gave back gains. Now, the market’s attention shifts to U.S. employment data (Non-Farm Payrolls, Unemployment Claims, Average Hourly Earnings) on July 2. A strong report could push the dollar higher, breaking the 0.810 resistance. A miss may send the pair back toward 0.790 support.
Technical Levels to Watch:
– Resistance: 0.810–0.815 (prior peaks and the June high)
– Support: 0.795–0.790 (recent consolidation lows and the 50-day moving average)
A break above 0.815 opens the door to 0.825. A drop below 0.790 risks a retest of 0.770.
The Bottom Line: Don’t chase the yield spread. This trade is about the dollar’s reaction to payrolls and the market’s appetite for safety. With a U.S. bank holiday on July 3, expect thinner liquidity after the data drop – that could amplify moves. Stay nimble.
COT Analysis
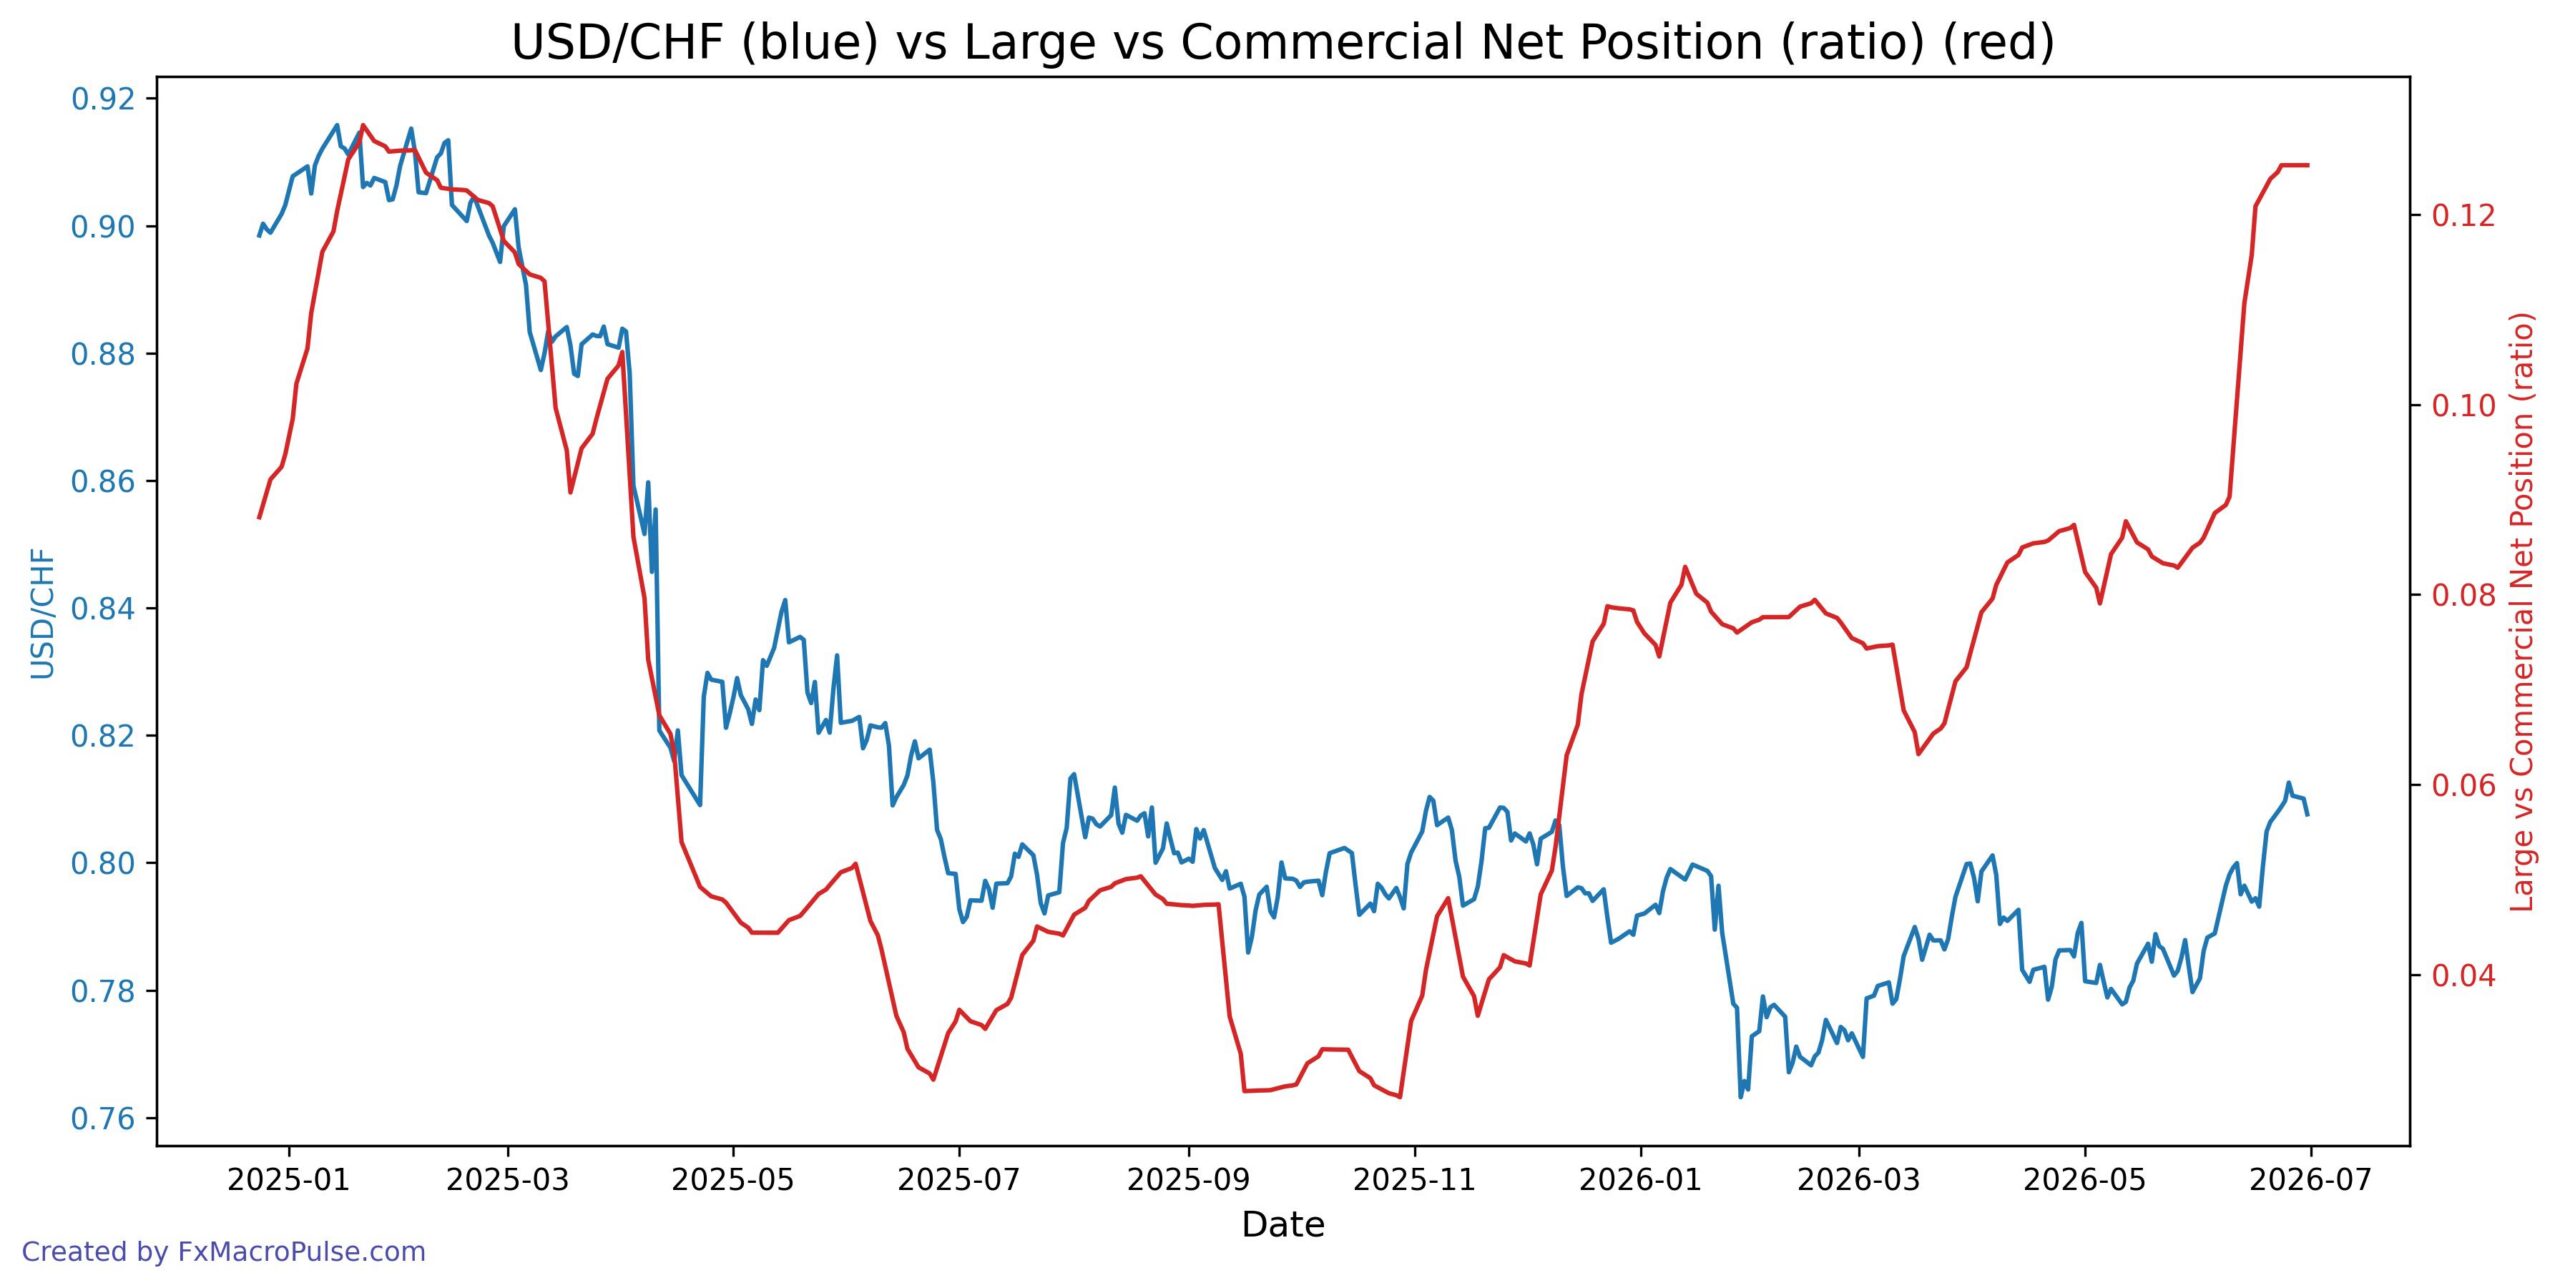
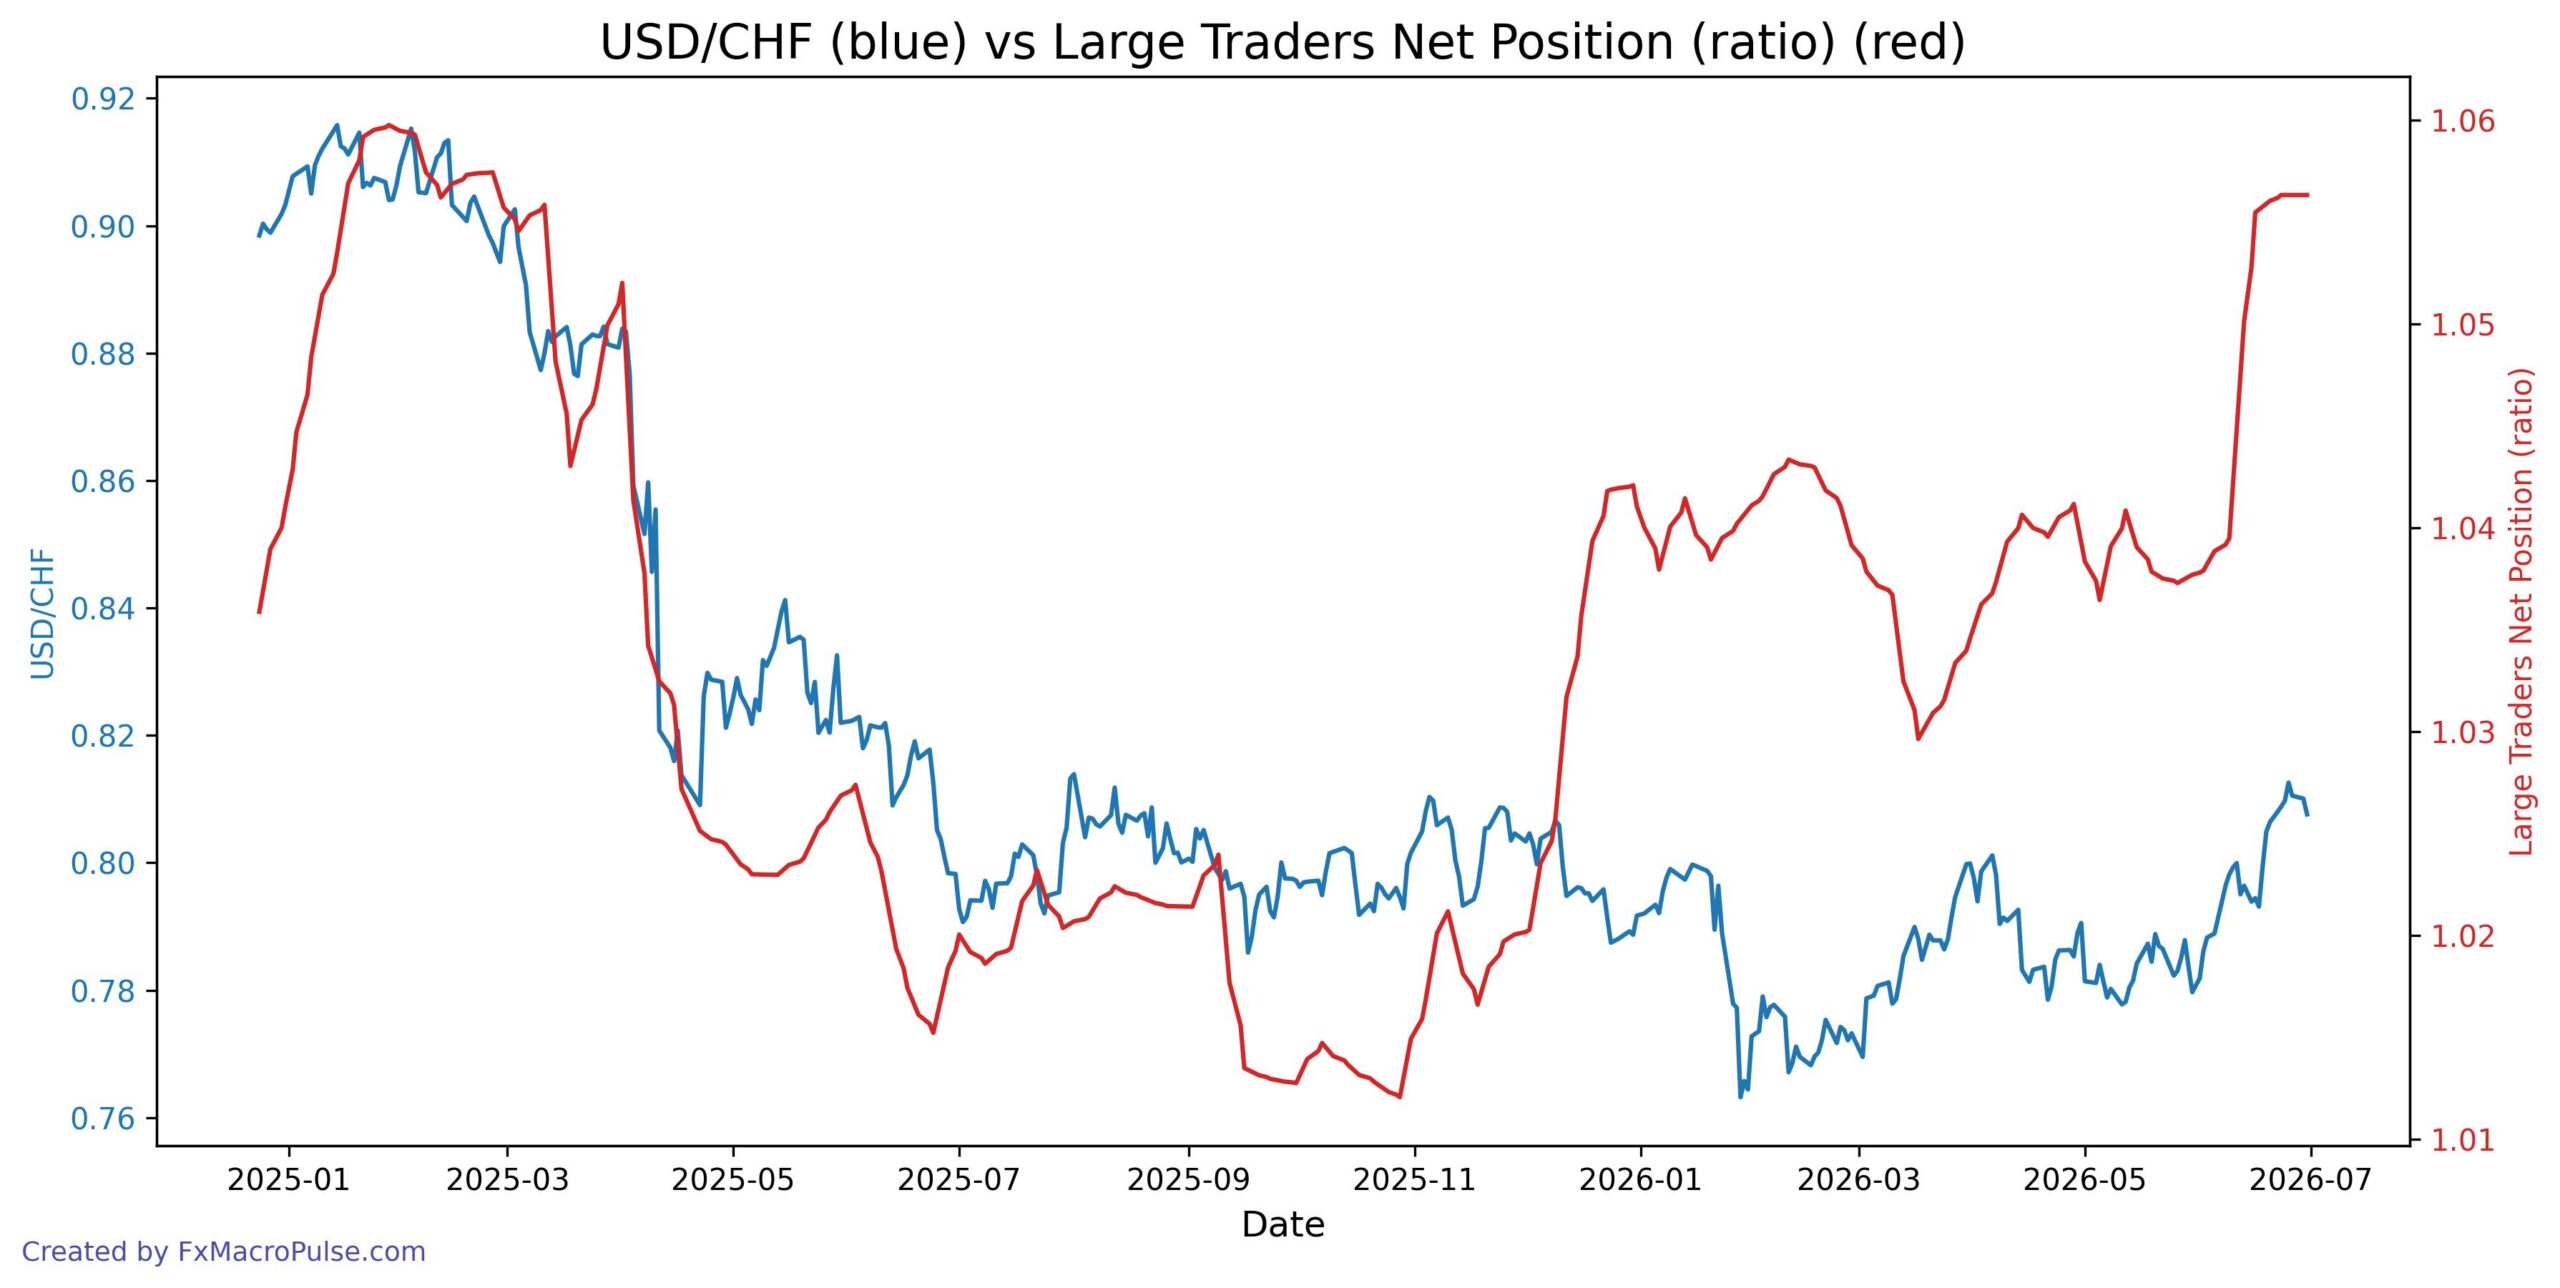
USD/CHF price and the Large vs Commercial Net Position ratio show a convergence in recent weeks. Price has rallied from the 0.78 area in late May to 0.81 in June, while the COT spread also rose from near 0.08 to 0.12. This alignment suggests that bullish sentiment in the futures market supports the current daily uptrend. On the weekly timeframe, both indicators remain below their early 2026 highs, so the broader trend is still cautious despite the short-term convergence.
USD/CHF daily price shows a clear uptrend from early 2026 lows near 0.76 to recent highs around 0.81, aligning with a steady rise in the Large Traders Net Position ratio (convergence). However, over the past few weeks, the price has pulled back from 0.812 while the ratio plateaued near 1.056, hinting at a possible loss of bullish momentum. Macro factors like Swiss franc strength and USD dynamics may be testing this correlation. Traders should monitor whether the ratio holds or declines for signs of divergence.
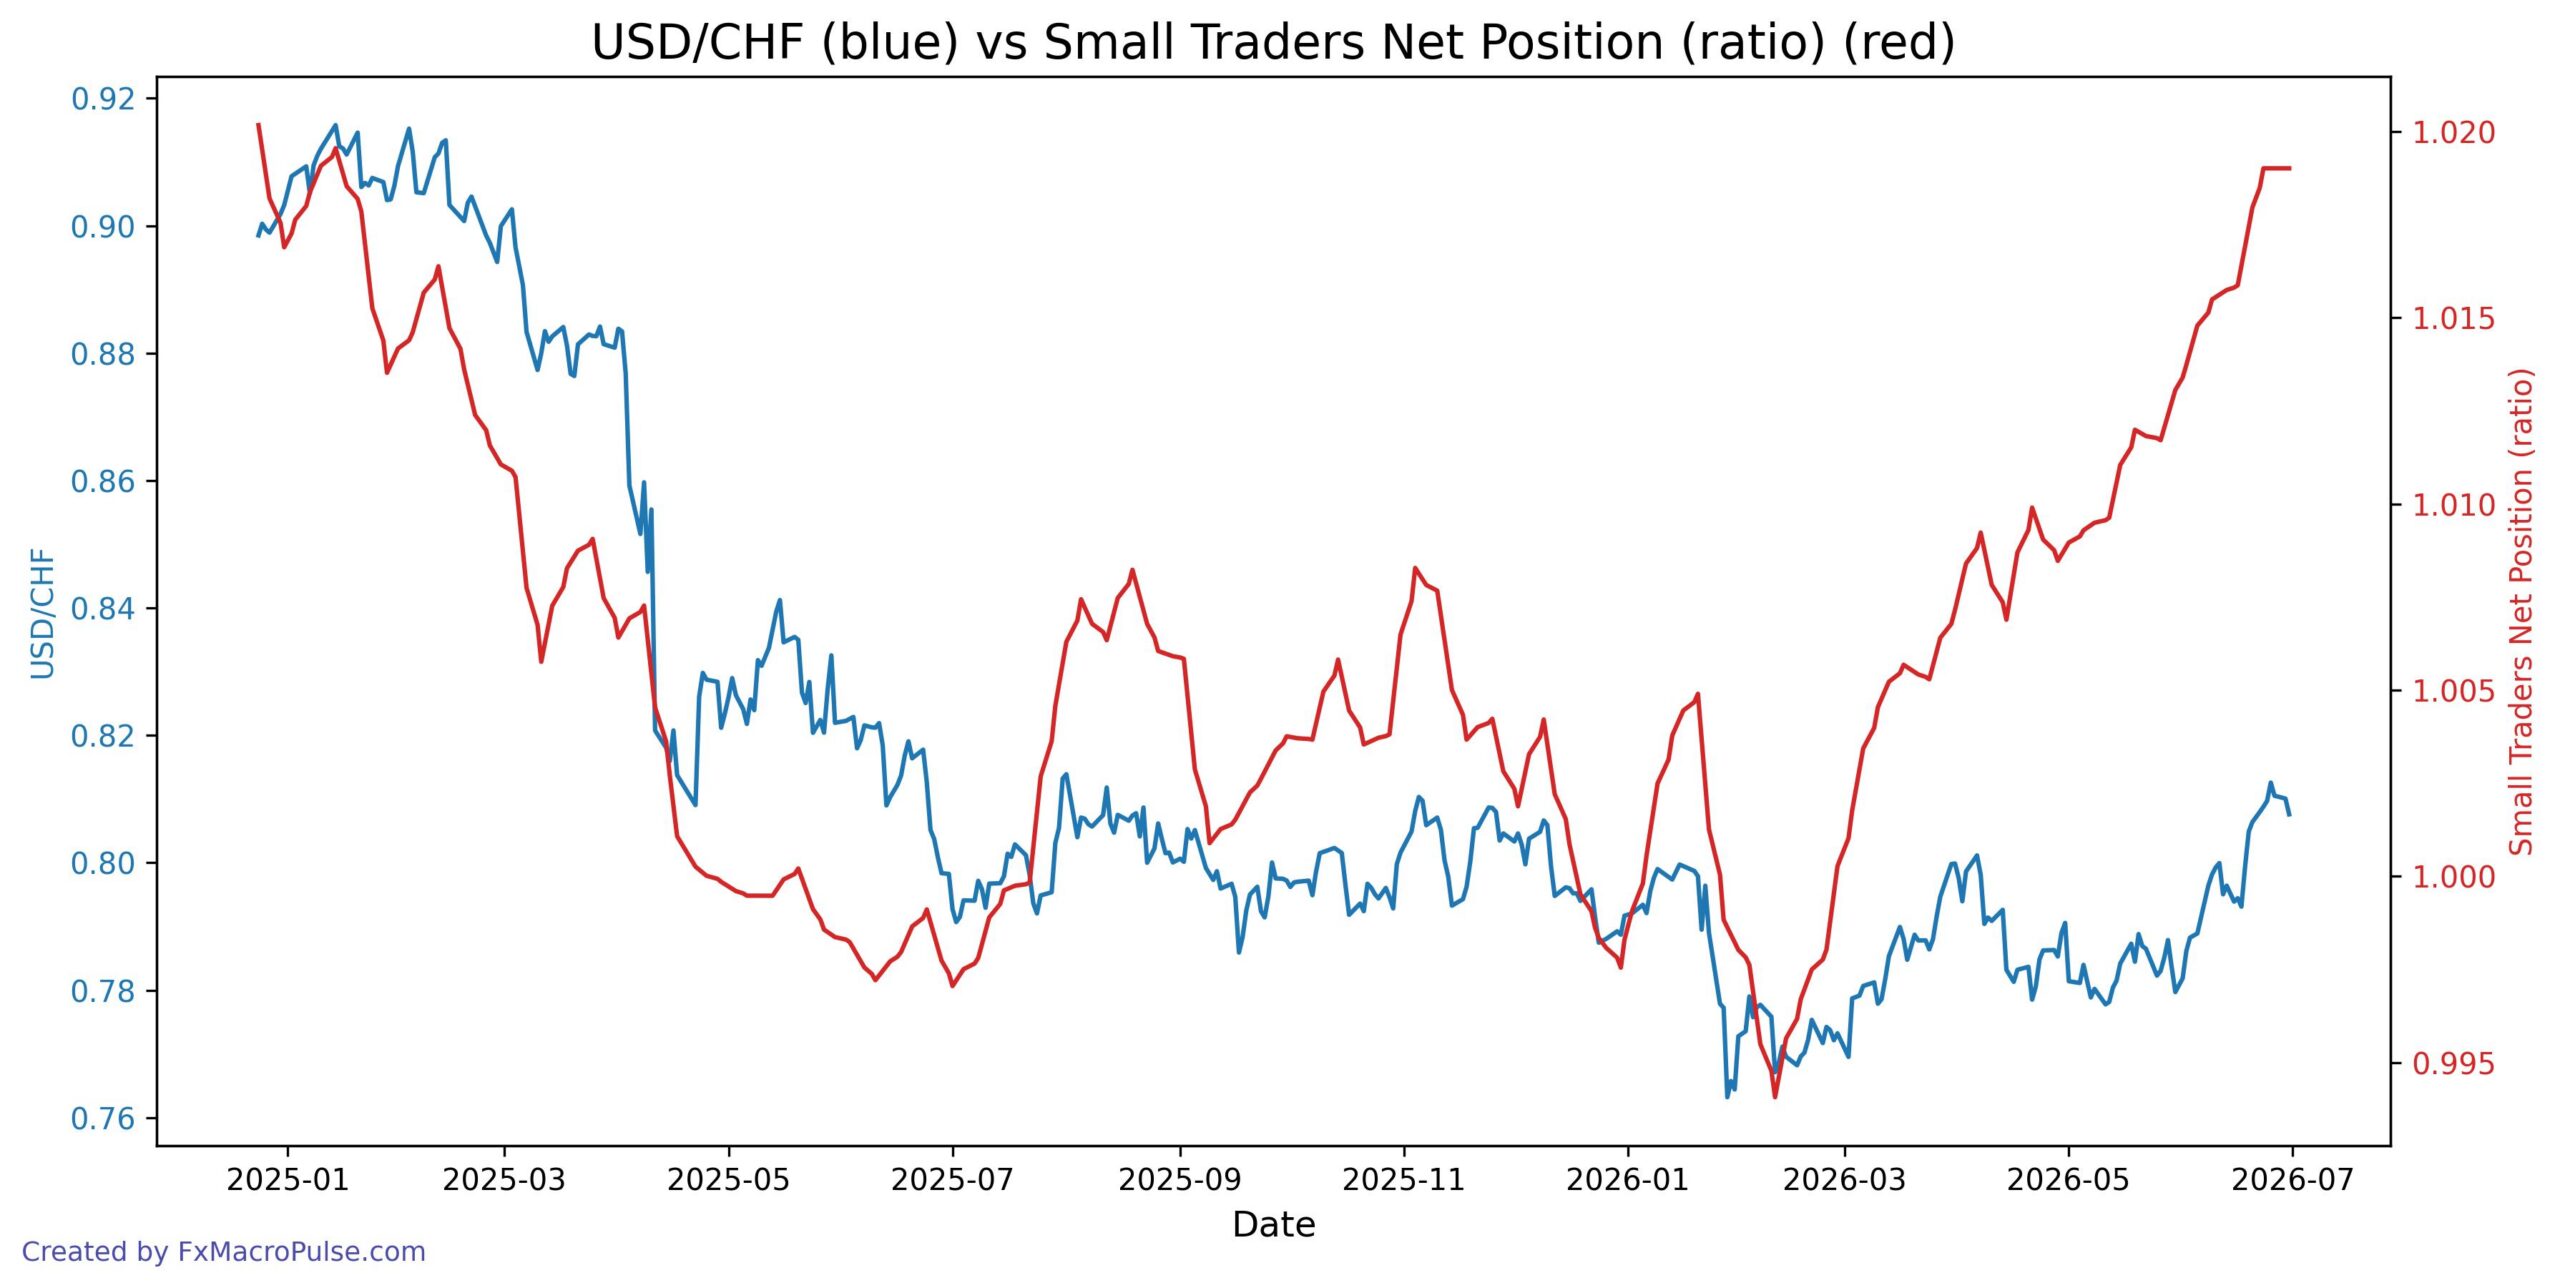
USD/CHF price moved sideways near 0.80–0.81 in recent weeks, while the Small Traders Net Position ratio stayed elevated above 1.019, indicating persistent long positioning by retail traders. This creates a bearish divergence: price failed to push higher despite strong speculative demand. The ratio also peaked in June 2026, while price remains well below its early 2026 highs, suggesting fading upside momentum. Traders should watch for a potential price pullback if small traders begin to unwind their long positions.