Macro Analysis
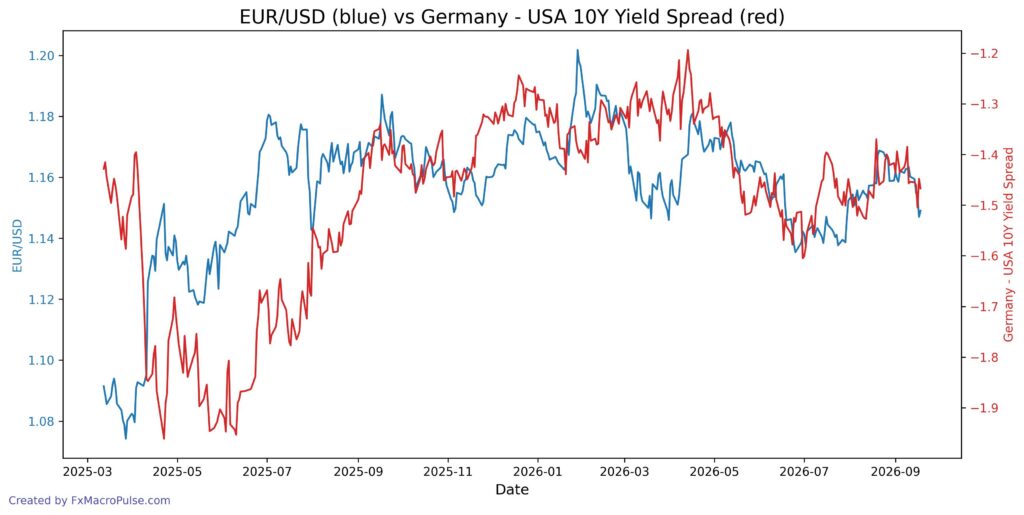
EUR/USD trades near 1.1490 after a daily pullback from 1.1688 on Aug 21. The pair has printed lower highs since then: 1.1634 on Sep 10, 1.1549 on Sep 15, and a low at 1.1470 on Sep 17. The latest close at 1.1490 keeps the daily bias tilted down. Support sits at 1.1460–1.1450. Below that, the June–July lows sit near 1.1354–1.1377. Resistance comes in at 1.1550, then 1.1600, and then the 1.1688 swing high. On the weekly chart, EUR/USD has made lower highs since the 1.2018 peak in late January 2026. The broader range runs roughly from 1.1350 to 1.1800. Price now sits in the lower-middle part of that range, so weekly momentum looks softer but not yet at the range floor.
The MacroFlow Index is a proprietary index created to track the pair’s fundamentals, and tracks the following: Germany/US 10Y Gov. Yield Spread, Germany/US Stocks Index Ratio, Gold Futures.
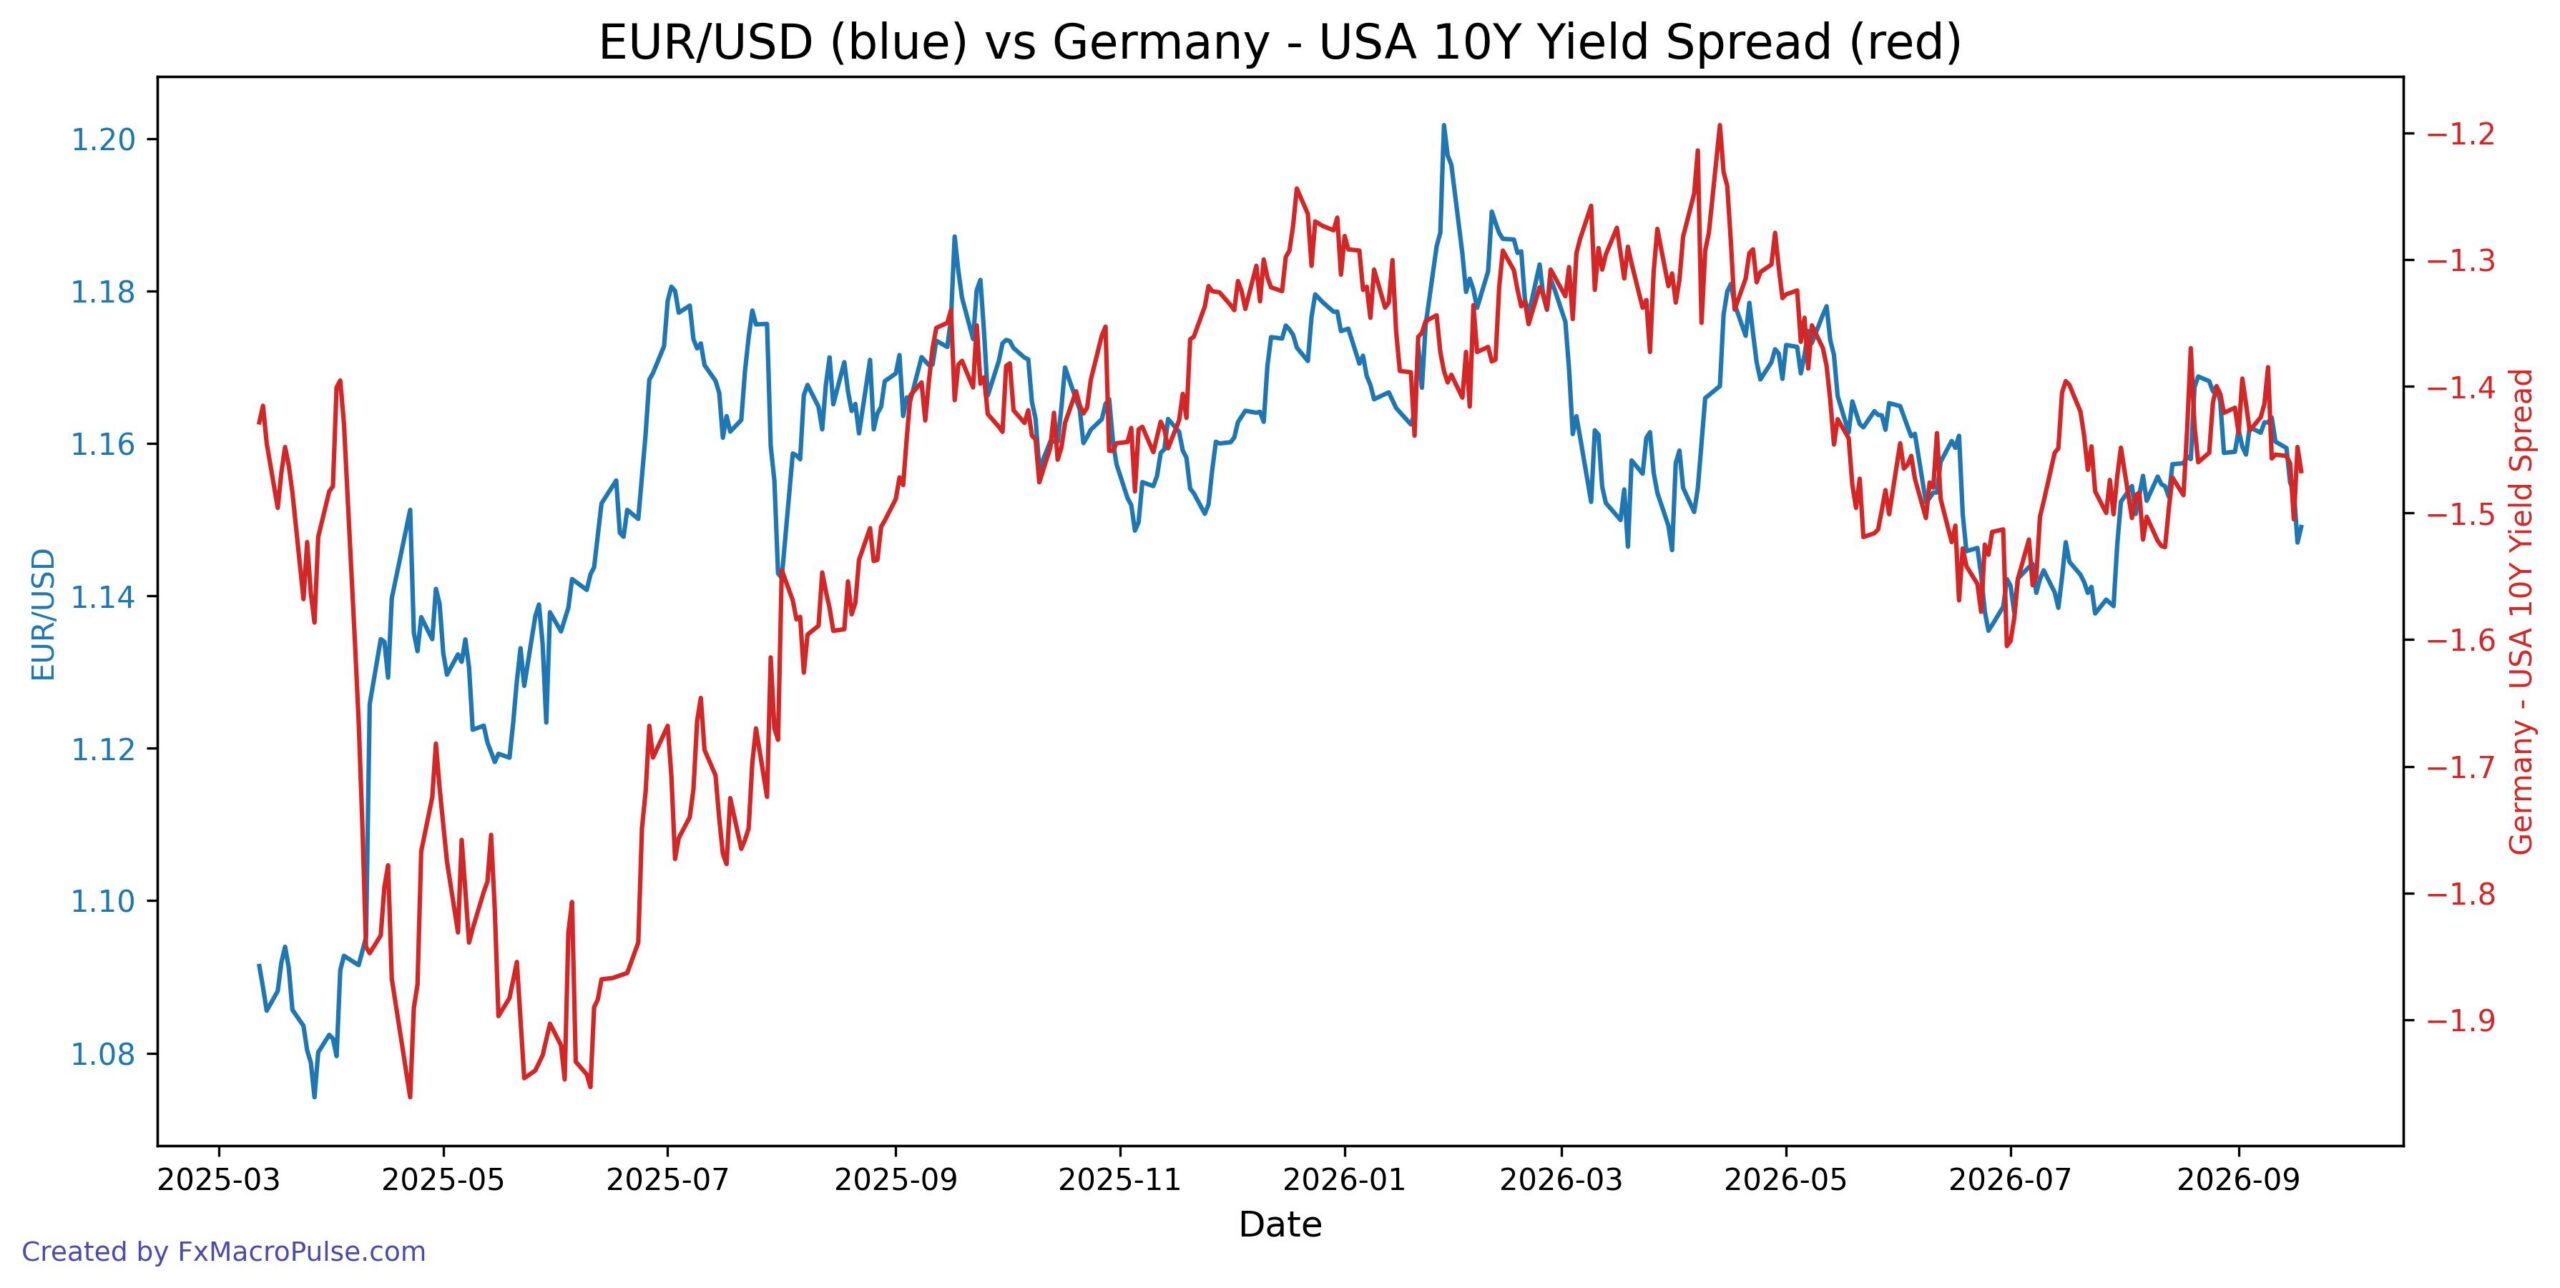
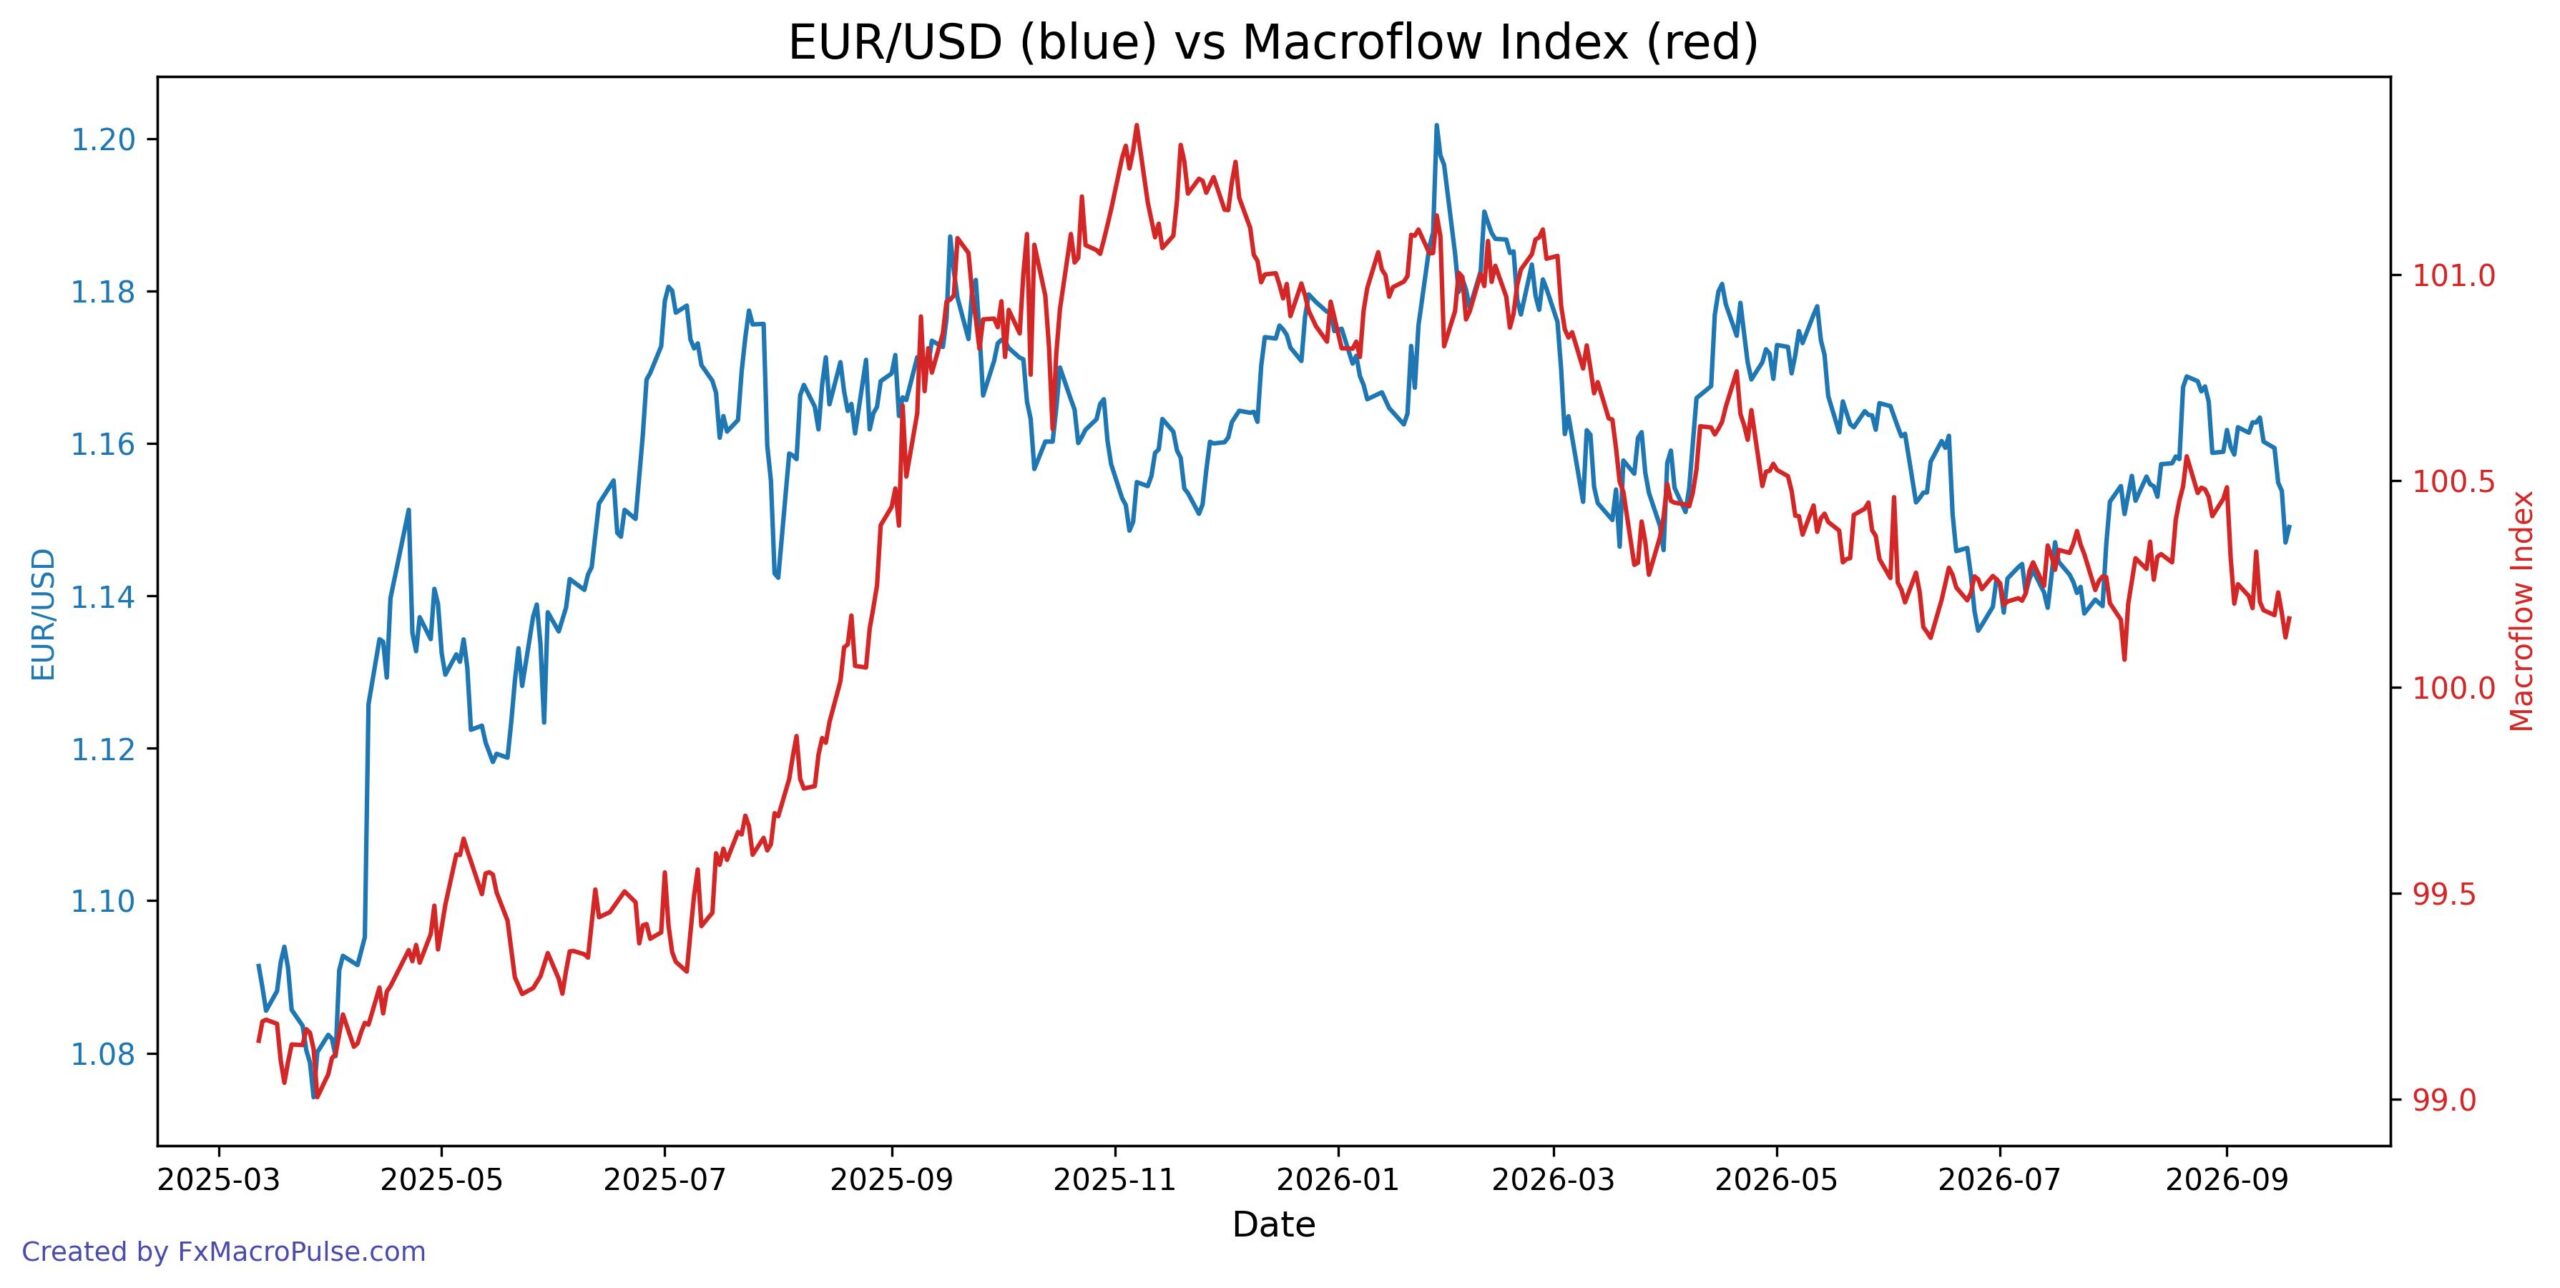
This index peaked at 100.559 on Aug 21, 2026, and slipped to 100.166 on Sep 18. That move is small, but it matches the direction of EUR/USD’s recent decline. The index remains above 100, so the underlying macro backdrop still looks firmer than the March 2025 level near 99.14. The Germany/US 10Y yield spread sits at -1.467, slightly more negative than -1.454 on Sep 11. Because the MacroFlow Index is positively correlated with that spread, a more negative spread works against the index. Still, the index ticked up from 100.120 to 100.166 on Sep 18, so the other inputs did not all move in the same direction.
From Aug 21 to Sep 18, EUR/USD and the MacroFlow Index both moved lower. That is convergence. However, EUR/USD fell about 1.7%, while the index fell about 0.4%. The pair weakened much more than the macro index. On Sep 17–18, both the pair and the index bounced together, another short-term convergence. The yield spread did not confirm that bounce because it became more negative. Earlier in July, the pair and the index diverged for periods: EUR/USD fell while the MacroFlow Index held up or rose. With a 0.42 correlation, such divergences are normal. Traders should treat MacroFlow as a context gauge, not a perfect timing signal.
Upcoming events can shift the components. ECB President Lagarde speaks on Sep 22. On Sep 23, Euro-area flash PMIs arrive: German services are forecast at 49.9 versus 48.5, German manufacturing at 54.0 versus 54.1, French services at 48.4, and French manufacturing at 50.9 versus 51.5. These releases can move EUR yields and the Germany/US stocks ratio. On Sep 24, US unemployment claims are forecast at 201K versus 196K. On Sep 25, revised UoM consumer sentiment is forecast at 47.5 versus 47.8, with inflation expectations previously at 4.6%. Daily levels to watch are 1.1460 support and 1.1550 resistance. Weekly traders will watch whether the MacroFlow Index continues to drift lower or stabilizes above 100, as that will help show whether macro drivers still confirm the pair’s direction.
COT Analysis
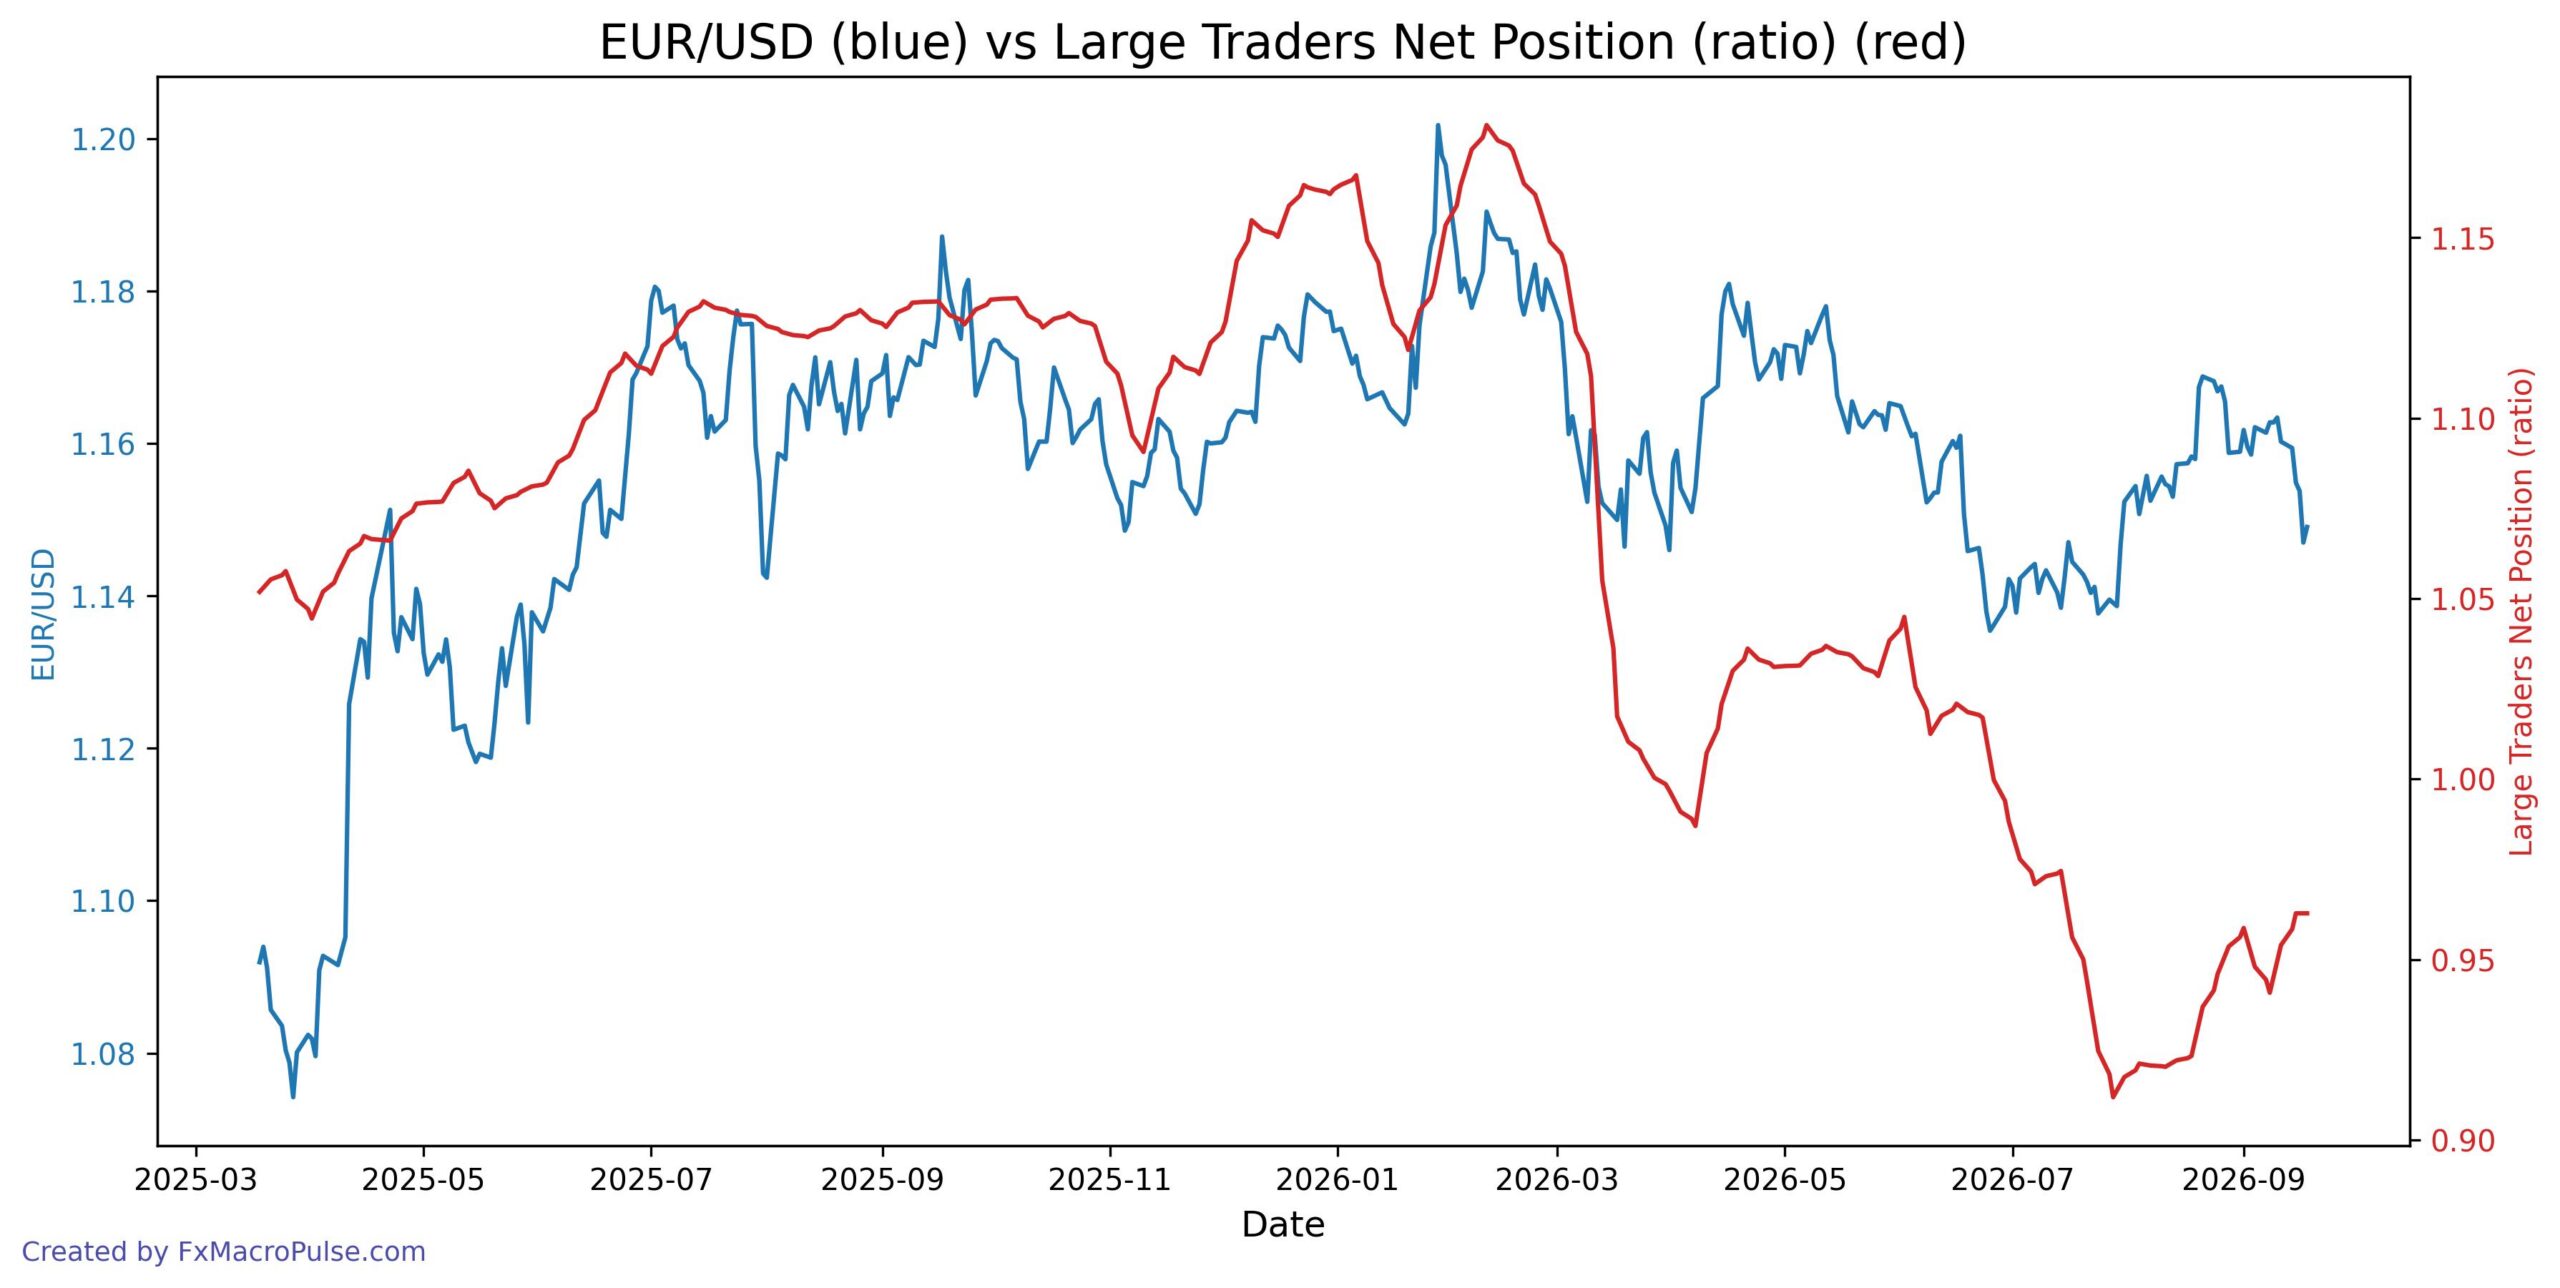
EUR/USD slipped from 1.1634 on 10 September to 1.1490 on 18 September, while the Large Traders Net Position ratio rose from 0.9408 to 0.9628 and then held flat. This is a short-term divergence: price weakens as the COT ratio rises. Late July showed convergence, when the ratio bottomed near 0.9119 and EUR/USD then rebounded from 1.1390 to 1.1688. Macro policy expectations often drive such gaps, so daily and weekly traders should watch whether price and COT positioning realign before acting on the divergence.
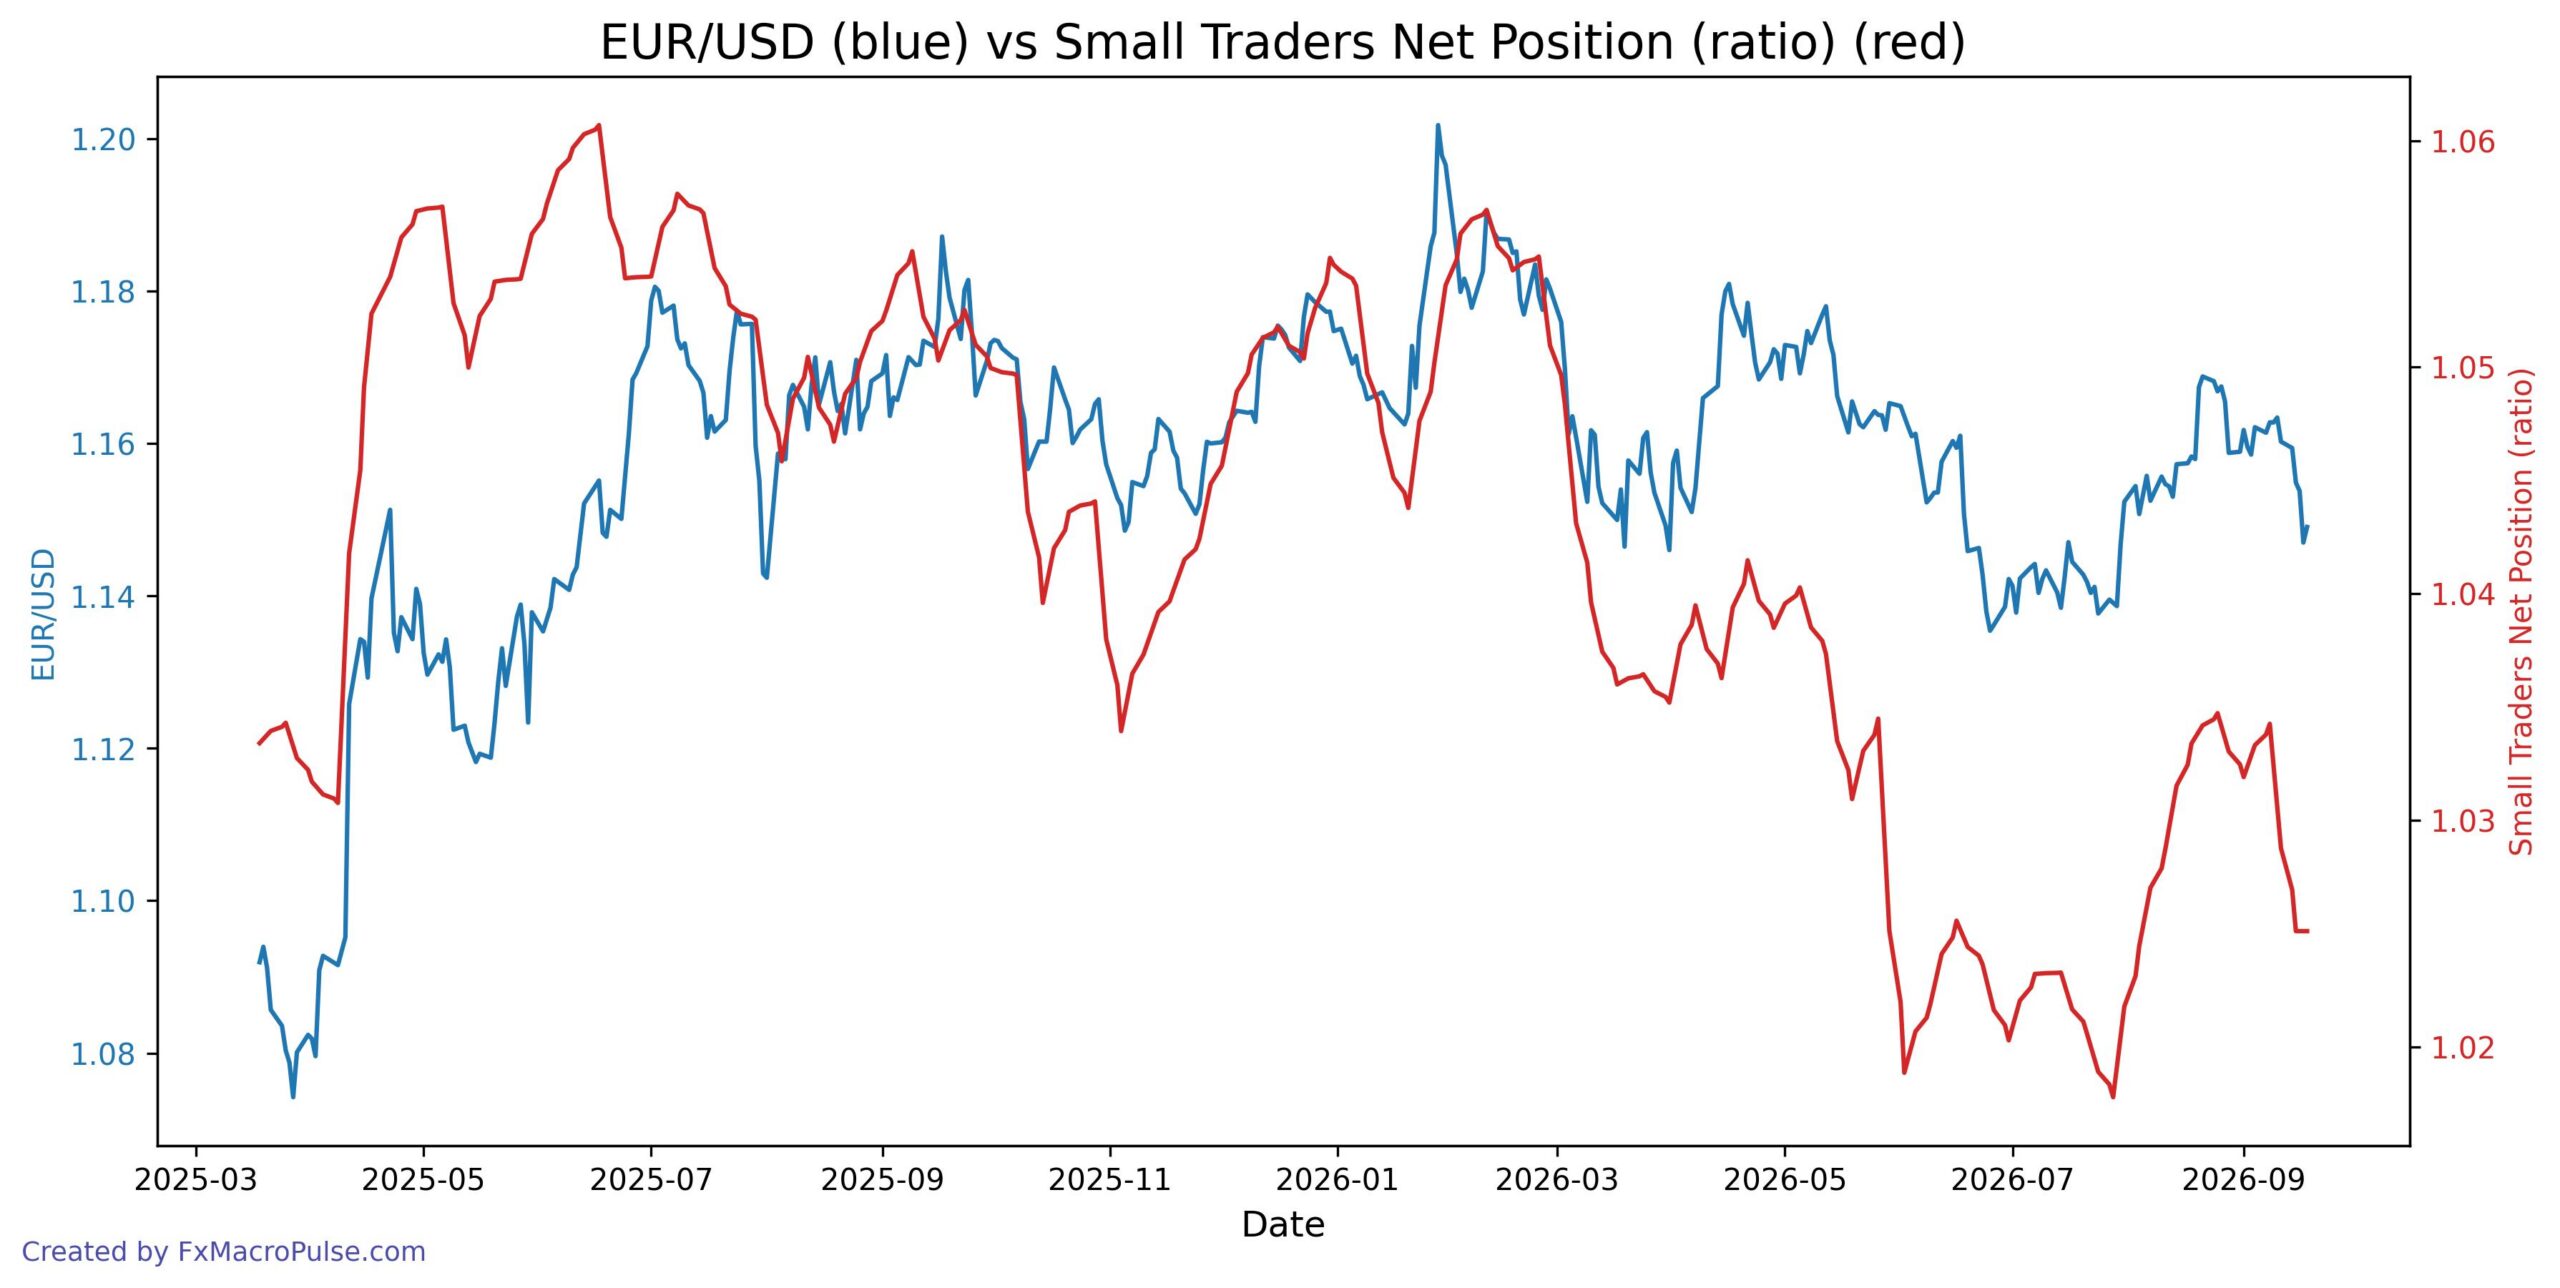
EUR/USD has set lower daily highs since its January 2026 peak near 1.2018, and it trades around 1.1490 after failing to hold above 1.1680 in August. The Small Traders Net Position ratio fell from 1.0342 in early September to 1.0251, showing downside convergence with price on the weekly timeframe. That ratio has flattened over the last few sessions while EUR/USD remains near its recent lows, a mild divergence traders can watch alongside the 1.1450–1.1500 support area.
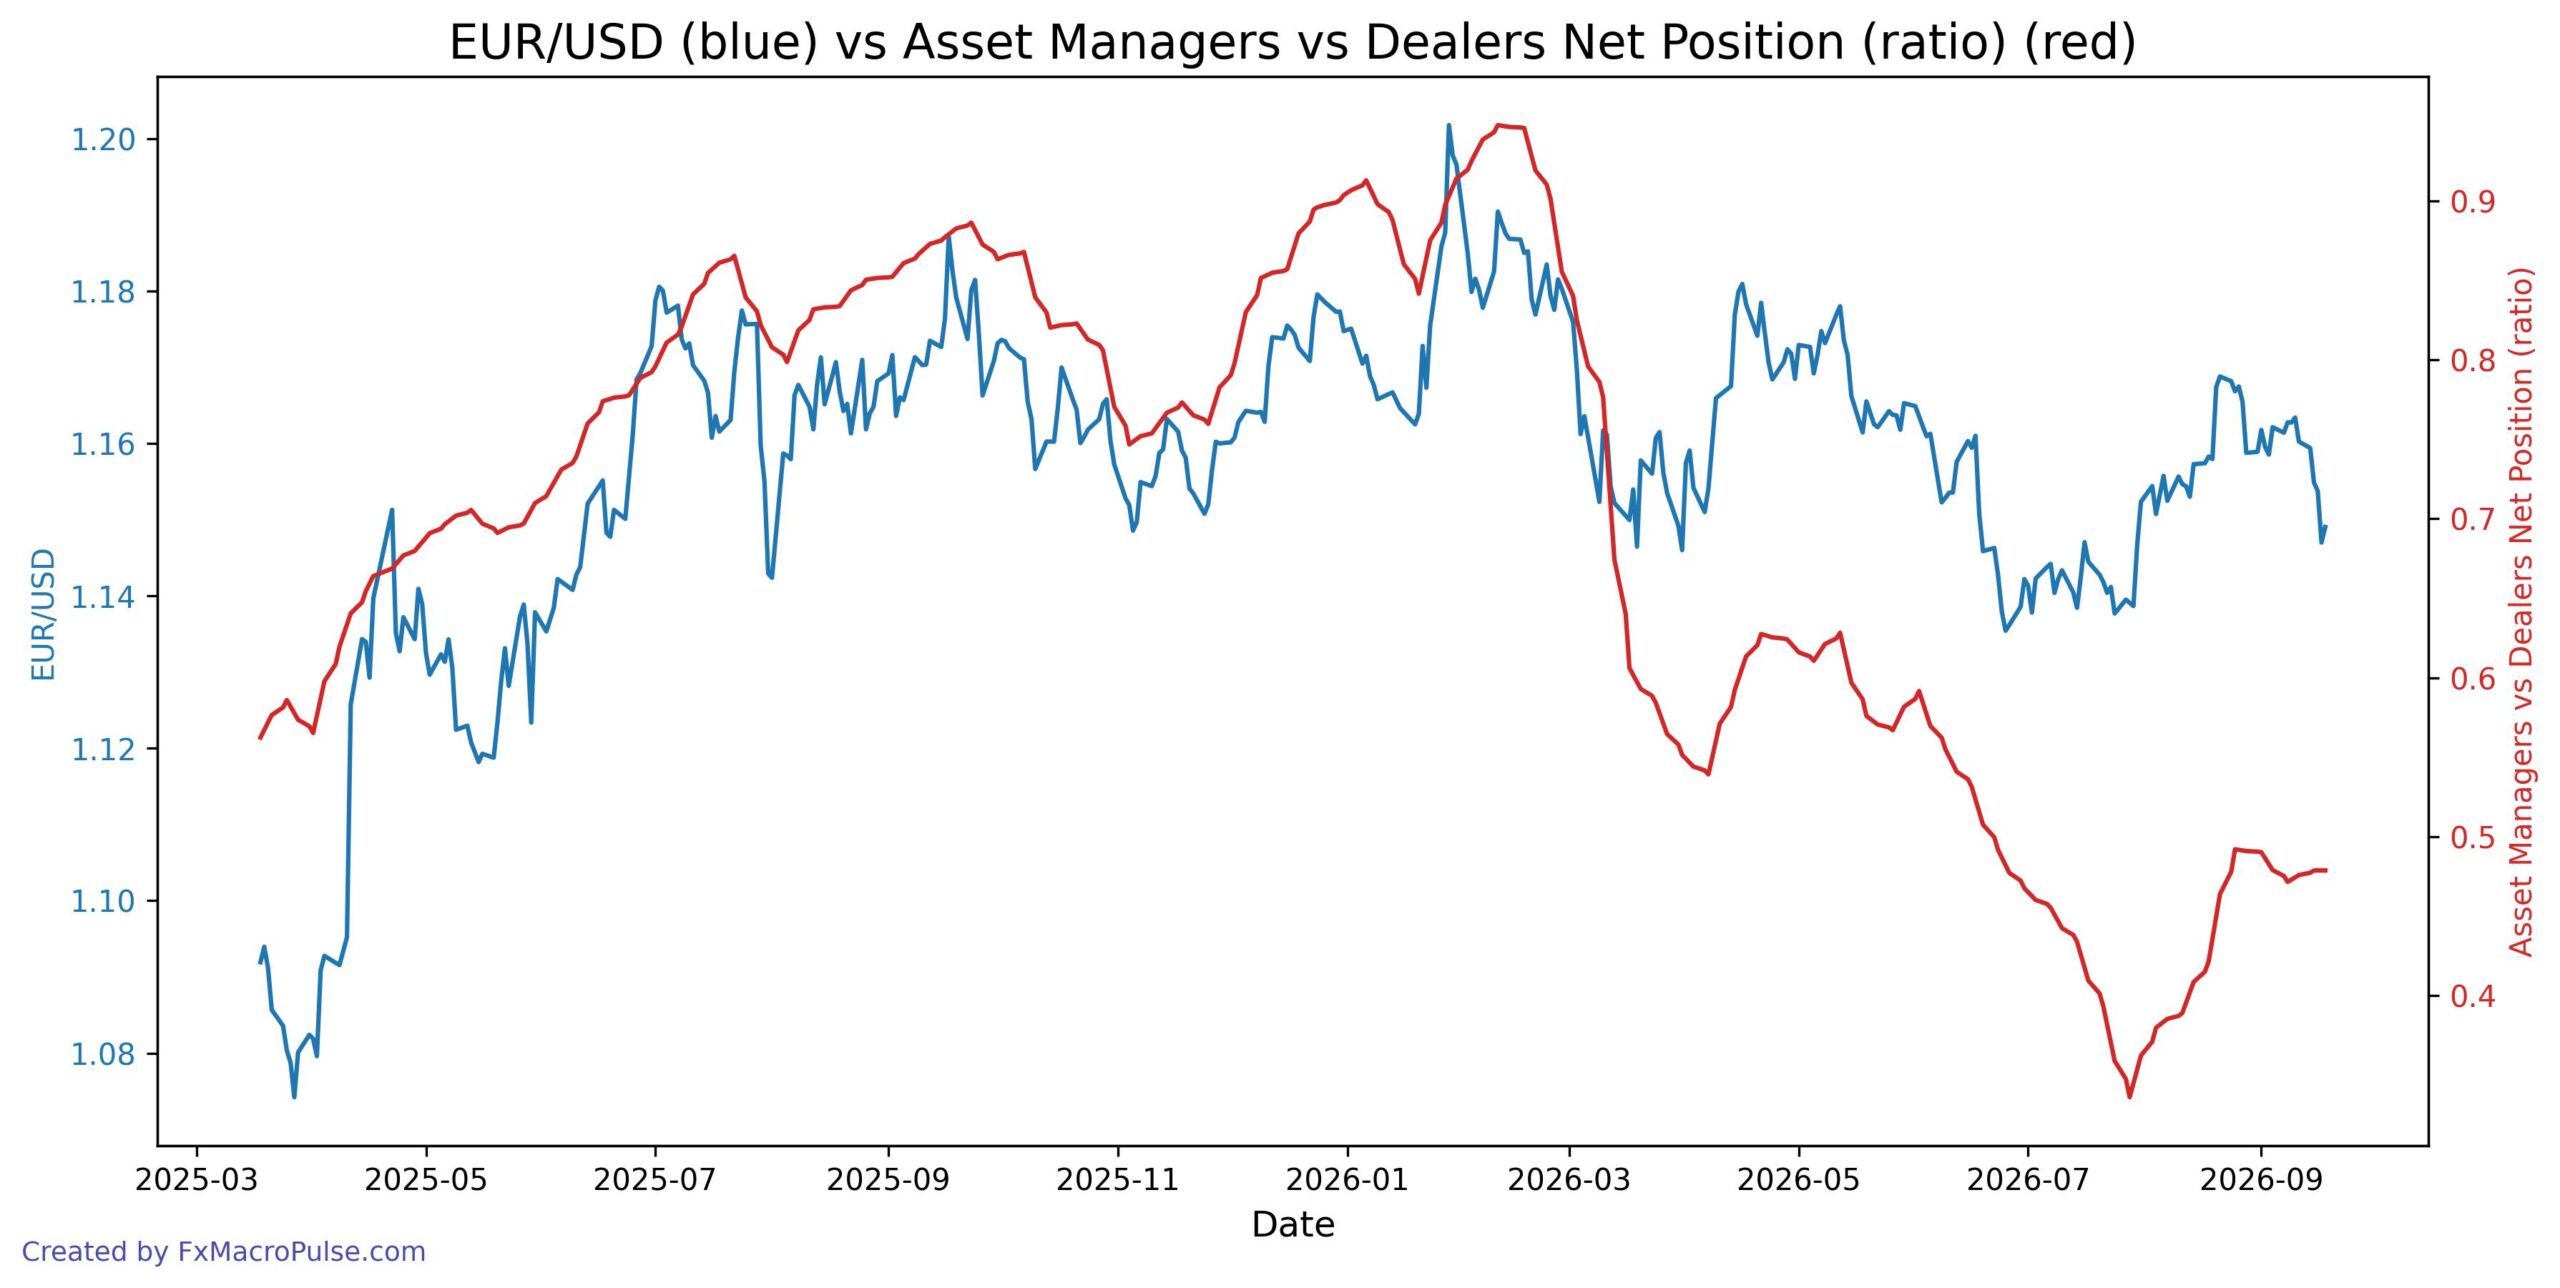
EUR/USD fell from 1.1639 on Sep 10 to 1.1490 on Sep 18, breaking below the 1.1550 area and testing the lower end of its recent weekly range. The Asset Managers vs Dealers net position ratio has flattened near 0.479 after rising from 0.336 in late July, so it no longer confirms the pair’s latest down move. This mild divergence suggests the daily pullback is occurring while speculative positioning stays relatively stable, not aggressively bearish. Traders may watch whether the ratio turns lower to match EUR/USD weakness or holds steady, which would keep the broader 1.14–1.17 range in focus.
News and Geopolitics
Escalating Middle East energy shocks are pressuring the Eurozone while simultaneously bolstering the safe-haven dollar, and US-EU trade tensions over Canada’s associate membership plus Germany’s political crisis are compounding fragmentation risks. A potential US-China trade truce extension and US midterm gridlock add event-dependent swings, keeping the outlook Bearish under Medium uncertainty.