
The bond yield spread Forex traders watch is the interest-rate gap between two countries’ government bonds, and it drives currency flows that news headlines rarely make explicit. The spread can be computed in about 60 seconds, read directly on a chart, and turned into a directional bias on a pair such as USD/JPY with four rules.
What is a bond yield spread that Forex traders actually watch?
A yield spread in forex is the difference between two countries’ government bond yields at the same maturity, most often the 10-year. Traders use it as a relative-return signal: money tends to flow toward the higher-yielding currency, all else equal (FP Markets).
Two clarifications first.
Your broker’s spread is the gap between bid and ask. A bond yield spread is a macro differential, measured in basis points.
The yield spread is calculated simply as:
Spread = Yield of the base currency’s country MINUS Yield of the quote currency’s country, at 10 years.
Why capital flow beats news headlines for the bond yield spread
Capital flow sets the durable direction of a currency pair. Headlines move price for hours. Relative return on cash moves it for months.
Think about what a large allocator actually does. A Japanese insurer or a European pension fund wants yield with acceptable risk. It compares the return on a US Treasury against the return on a Japan government bonds. When the US leg pays 205 basis points (2.05%) more, the fund hedges its currency exposure and buys Treasuries. That hedging and buying is the capital flow, and it lands in the spot market.
The academic framework for this is uncovered interest parity, where the rate differential should equal the expected change in spot rates (Deutsche Bundesbank). The real world deviates from it constantly. Covered interest parity, the hedged version, broke down after August 2007, and deviations peaked at 289bp annualised in September 2008 and 149bp in November 2011. BIS researchers found that a stronger dollar goes together with bigger deviations from covered interest parity and contractions in cross-border dollar bank lending (BIS).
The lesson: the spread is a real force with real frictions. The plumbing can jam, and that is where your risk management has to live.

How to calculate the bond yield spread yourself
Subtract the quote currency’s 10Y yield from the base currency’s 10Y yield. That is the entire manual formula.
Here is a worked USD/JPY example using data as of 18 September 2026, the most recent figures in my research:
5.00% − 2.95% = +2.05%, or +205 basis points.
That is your manual bond yield spread calculator. Three steps:
- Open your yield source and find the 10Y for both countries.
- Convert to decimals (5.00% becomes 5.00, 2.95% stays 2.95).
- Subtract the quote country from the base country. Multiply by 100 for basis points.
Run the same numbers for the other majors at that date:
| Pair | 10Y base | 10Y quote | Spread (bp) |
|---|---|---|---|
| USD/JPY | US 5.00% | Japan 2.95% | +205 |
| EUR/USD | Germany 3.51% | US 5.00% | −149 |
| GBP/USD | UK 5.29% | US 5.00% | +29 |
| AUD/USD | Australia 5.26% | US 5.00% | +26 |
The EUR/USD row is the one that flips the usual intuition. Under this article’s convention, EUR/USD’s spread is German minus US, and it is negative. That is a euro-negative reading on a pair quoted in dollars. Always check which currency sits in the base before you translate a spread sign into a trade direction.
That is the slow version. Building it in a spreadsheet means maintaining four yield sources, matching timestamps, and repeating the work whenever a leg updates. We track the same differential live for every pair we cover in FXMacroPulse, this site’s own dashboard. Third-party charting and macro data services do the same, though their features vary and none of them were verified for this article. Learn the arithmetic anyway. Tools change, and understanding the calculation is what stops you trusting a number you do not understand.
Where to get the raw yields
Use primary sources, not reposts:
- US: FRED series DGS10 and DGS2, or the Treasury’s own Daily Par Yield Curve.
- UK: the Bank of England yield curves.
- Germany: the Bundesbank daily term structure.
- Australia: the RBA statistics tables.
One warning on timing. The US Treasury publishes its par yields as a once-daily fix from bid-side indicative quotes taken at roughly 3:30 PM each business day (US Treasury). The Bank of England publishes its fitted curves by noon the following business day (Bank of England). A “live” spread built from those two is misaligned by the better part of a day. Match timestamps or accept the lag.
Reading the bond yield spread chart: divergence and convergence
Divergence between the spread and the pair signals something is overriding rate differentials. Convergence restores the relationship. Both are tradeable, in different ways.
The spread chart plots the differential as a single line, with price overlaid. Four states matter:
Spread rising, price rising. The textbook regime. Capital is flowing toward the higher-yielding currency and price agrees. Trend-following works here.
Spread rising, price falling. The regime everyone gets wrong. Something bigger is overruling the rate story, usually a risk-off shock or intervention. Japan’s record ¥6,278.7bn single-day intervention on 30 April 2026 is the clearest recent example (Qazinform). Treat this as a warning sign rather than a trade signal.
Spread falling, price falling. A clean unwind in reverse. De-risking follows the interest rate logic.
Spread flat, price trending. Something else entirely drives the pair. Stand aside and use a different tool.
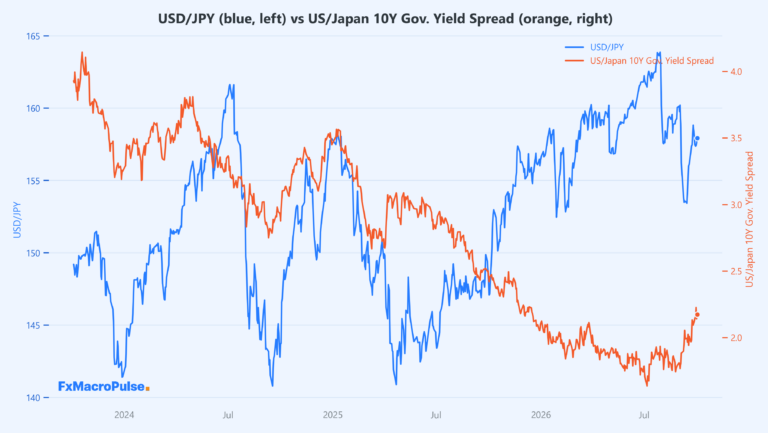
10-year yield spread (USD/JPY)
Yield spread trading strategy: four rules
The four rules below frame the spread as a directional filter, never as an entry trigger on its own.
Rule 1: Direction filter
A spread filter only takes trades in the direction the spread supports. When the 10Y spread is making higher highs on a weekly basis, the flow read favors longs on that pair and rules out shorts. Lower lows point the other way.
This rule alone will keep you out of a lot of bad counter-trend trades. It will also keep you out of some good ones. That is the cost of the filter. Its job is to raise the hit rate across a sample of trades.
Rule 2: Confirmation
The spread and price need to agree on the same timeframe before size goes on. If the spread breaks out to a new 3-month high while price sits below its 50-day average, the two lines disagree, and there is no confirmed setup yet. The goal is two independent lines saying the same thing.
On how long this takes: a 10Y spread move does not transmit to spot overnight. Institutional allocation decisions run on monthly and quarterly cycles. If you scalp five-minute charts, the spread is the wrong tool for you.
Rule 3: Extreme-spread reversals
When the spread reaches a multi-year extreme and then stalls, reversal setups come into focus. Stretched differentials attract positioning, and positioning attracts deleveraging.
August 2024 is your case study. USD/JPY fell from roughly 161 to about 141.70 on a positioning shock rather than a spread move, and the BIS framed it as procyclical deleveraging and margin increases amplifying the volatility (BIS). The Nikkei dropped 12.4% in a single session on 5 August 2024 (Lambda Finance).
Extreme-spread reversals are the highest-reward and lowest-frequency setups here. They also carry the highest tail risk. Position sizing has to assume being early twice before being right.
Rule 4: Invalidation
The spread level that kills the thesis gets written down before entry. If the 10Y spread falls back below the level that first gave the long bias, the thesis is dead regardless of what price is doing, and the position comes off.
This rule rarely appears in published explainers, and it is what separates a framework from a hunch.
Do bond yields lead currency prices?
Sometimes, and the evidence does not support a permanent rule.
The Bundesbank is direct about this, stating that the empirical carry relationship contrary to uncovered interest parity “can no longer be found in the period since the global financial crisis” (Deutsche Bundesbank). That is a serious finding from a central bank research desk.
The September 2026 Bank of Japan meeting is the cleanest recent counter-example. The BoJ raised rates to 1.25%, a 31-year high, and the yen weakened anyway. As Reuters put it, the move “did not boost the Japanese currency” (Reuters via Yahoo Finance).
The relationship is not dead either. Bloomberg reported on 14 September 2026 that the 30-day rolling correlation between the dollar and 10-year yields had risen above 0.40, its highest in more than two months (Bloomberg).
My read: the spread is a regime indicator. It tells you which way the current runs, and the timing still comes from price.
The commodity overlay: why the raw spread is incomplete
A raw yield spread ignores a second driver of demand for commodity currencies. For AUD/JPY and USD/CAD, that omission matters.
The Canadian and Australian dollars both carry terms-of-trade exposure. Canada exports oil. Australia exports iron ore, coal and gold. When those prices move, the trade balance moves, and so does structural demand for the currency. That channel runs independently of the interest rate differential.
Empirically these relationships are unstable, and you should treat them as directional context rather than a number you can lean on. A cited WSJ figure put the CAD-Brent correlation at around −0.30, and later reporting described the Canadian dollar’s oil relationship as having weakened (WSJ). Gold’s link to the Australian dollar has been documented at +0.84 on one 2011 estimate and has swung from −0.77 to +0.41 depending on the measurement window in a 2012 DailyFX table. Neither is a stable input, and I would not size a position on either number.
Here is the practical use. When the yield spread says long AUD/JPY but iron ore and copper are rolling over, you have conflicting signals. Take a smaller position or none at all. When the spread and the commodity complex agree, you have genuine two-source confirmation.
AUD/JPY is the pair where this matters most. It stacks three drivers: the yield differential, the commodity terms-of-trade channel, and global risk appetite. JPY is a funding currency, so risk-on flows out of it and into higher-yielding commodity currencies. When all three align, AUD/JPY trends hard. When they conflict, it chops and eats stops.
That is why a single-line spread chart is a starting point. Watching a commodity price chart next to the yield spread gives you the same benefit: you want oil next to USD/CAD, and metals next to AUD/JPY, on the same screen as the differential. You can set that up yourself with two charts and no extra software.

Photo: Yashowardhan Singh on Unsplash
Yield spreads beyond USD/JPY
USD/JPY gets the attention because Japan’s yield curve moved more than any other this decade. The framework works elsewhere, with different wrinkles.
EUR/USD: the pair with the inverted sign
Under the convention in this article, EUR/USD’s spread is German Bund minus US Treasury, which was −149bp on 18 September 2026. A negative reading means the euro’s yield advantage is absent.
The complication is the euro’s role as a financing and reserve currency. EUR/USD responds to the differential, then overshoots on relative growth expectations. The direction filter still applies, but expect more false confirmations than on USD/JPY.
Watch the German leg closely. Bunds sit at the core of euro area pricing, and a Bund move driven by fiscal news transmits to EUR differently than one driven by ECB policy expectations.
AUD/JPY: the risk-barometer pair
Australia’s 10Y stood at 5.26% against Japan’s 2.95%, a +231bp spread favouring the Aussie. That is a wide differential, and it is why AUD/JPY behaves the way it does in risk-off episodes.
The spread justifies a long structural bias. It does not protect you when global equity markets sell off, because the yen’s funding-currency status dominates in a deleveraging event. Trade AUD/JPY longs small and with hard invalidation levels.
GBP/USD: the narrow-spread pair
The UK 10Y was 5.29% against the US 5.00%, giving GBP/USD a +29bp spread. That is thin. When the differential is small, small changes in either leg flip the sign, and the spread loses most of its signal value.
For narrow-spread pairs, widen your confirmation window. Require the spread to hold its direction for a month before you build a bias on it.
So the government bond yield differential works best where the gap is wide and the trend is persistent, and worst where the gap is thin and choppy.
Frequently asked questions
What is a bond yield spread in forex?
A bond yield spread is the difference in yields between two countries’ government bonds of the same maturity, most commonly the 10-year. Traders use it as a relative-return and capital-flow signal for a currency pair (FP Markets). Do not confuse it with your broker’s bid-ask spread.
Do bond yields lead currency prices?
The evidence is contested and regime-dependent. Practitioner sources treat the spread as a meaningful leading indicator, but Bundesbank research finds the carry relationship no longer holds post-GFC. The September 2026 BoJ hike to 1.25% weakened the yen instead of strengthening it (WSJ).
How do I calculate the US–Japan 10-year spread?
Subtract the JGB 10Y yield from the US Treasury 10Y yield. On 18 September 2026: 5.00% minus 2.95% equals +205 basis points. State your ordering explicitly, because reversing it flips the sign and inverts every directional conclusion.
What is a normal US–Japan 10-year spread?
There is no fixed normal. Over twelve months to September 2026 the Japan 10Y moved roughly +133bp while the US 10Y moved around +87bp, so the spread itself shifted materially (Bloomberg). The spread makes sense against its own recent range; a fixed threshold does not hold across regimes.
Where can I get the raw yields for free?
FRED series DGS10 and DGS2 cover the US (FRED). The US Treasury’s Daily Par Yield Curve page gives the official fix. The Bank of England publishes gilt curves, and the Bundesbank publishes daily Bund term structure data.
How often does the 10-year spread update?
It depends on the slowest leg. The US par yield fixes once daily at roughly 3:30 PM ET (US Treasury), and the BoE curve publishes by noon the next business day (Bank of England). A spread built from mismatched timestamps is not live, it is misaligned.
About the Author
 I’m Sam Hayes, a market analyst hailing from London with 10 years of experience covering macroeconomics, central bank policy, and G10 currency flows. After earning a degree in Economics from the University of Bristol, I began my career as a junior risk analyst at a London-based prop firm before moving to an institutional FX research desk in the heart of London.
In my articles, I focus on breaking down complex macro drivers—like yield differentials and risk sentiment—into clear, practical insights that you can apply directly to your trading.