Macro Analysis
The British Pound (GBP/USD) is trading around 1.3243 as of October 5, 2026. After a steady decline from its August peak of 1.3654, the pair recently found a temporary floor at 1.31996 before staging a mild recovery.
-
Key Support Levels to Watch:
-
1.3200: A crucial psychological level holding the current floor.
-
1.3165: The next safety net if selling pressure breaks lower.
-
-
Key Resistance Levels to Watch:
-
1.3265: Immediate hurdle for buyers.
-
1.3300 – 1.3350: Heavy resistance zone for any sustained rally.
-
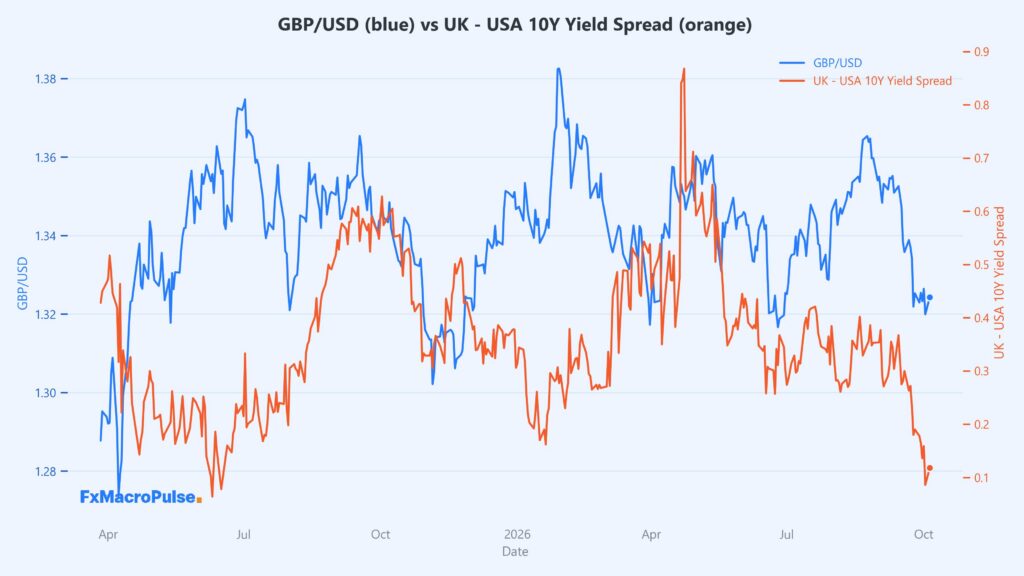
The prices vs bond yield spreads narrowed from 0.386 on Aug 26 to 0.086 on Oct 2, then 0.118 on Oct 5. That is the lowest in the dataset. A narrower spread typically reduces the USD yield advantage over GBP. Yet GBP/USD did not rally strongly. This divergence hints that USD strength or GBP weakness from other factors, like risk sentiment, offset the yield signal. If the spread stays low, watch whether GBP/USD can build a base above 1.3200.
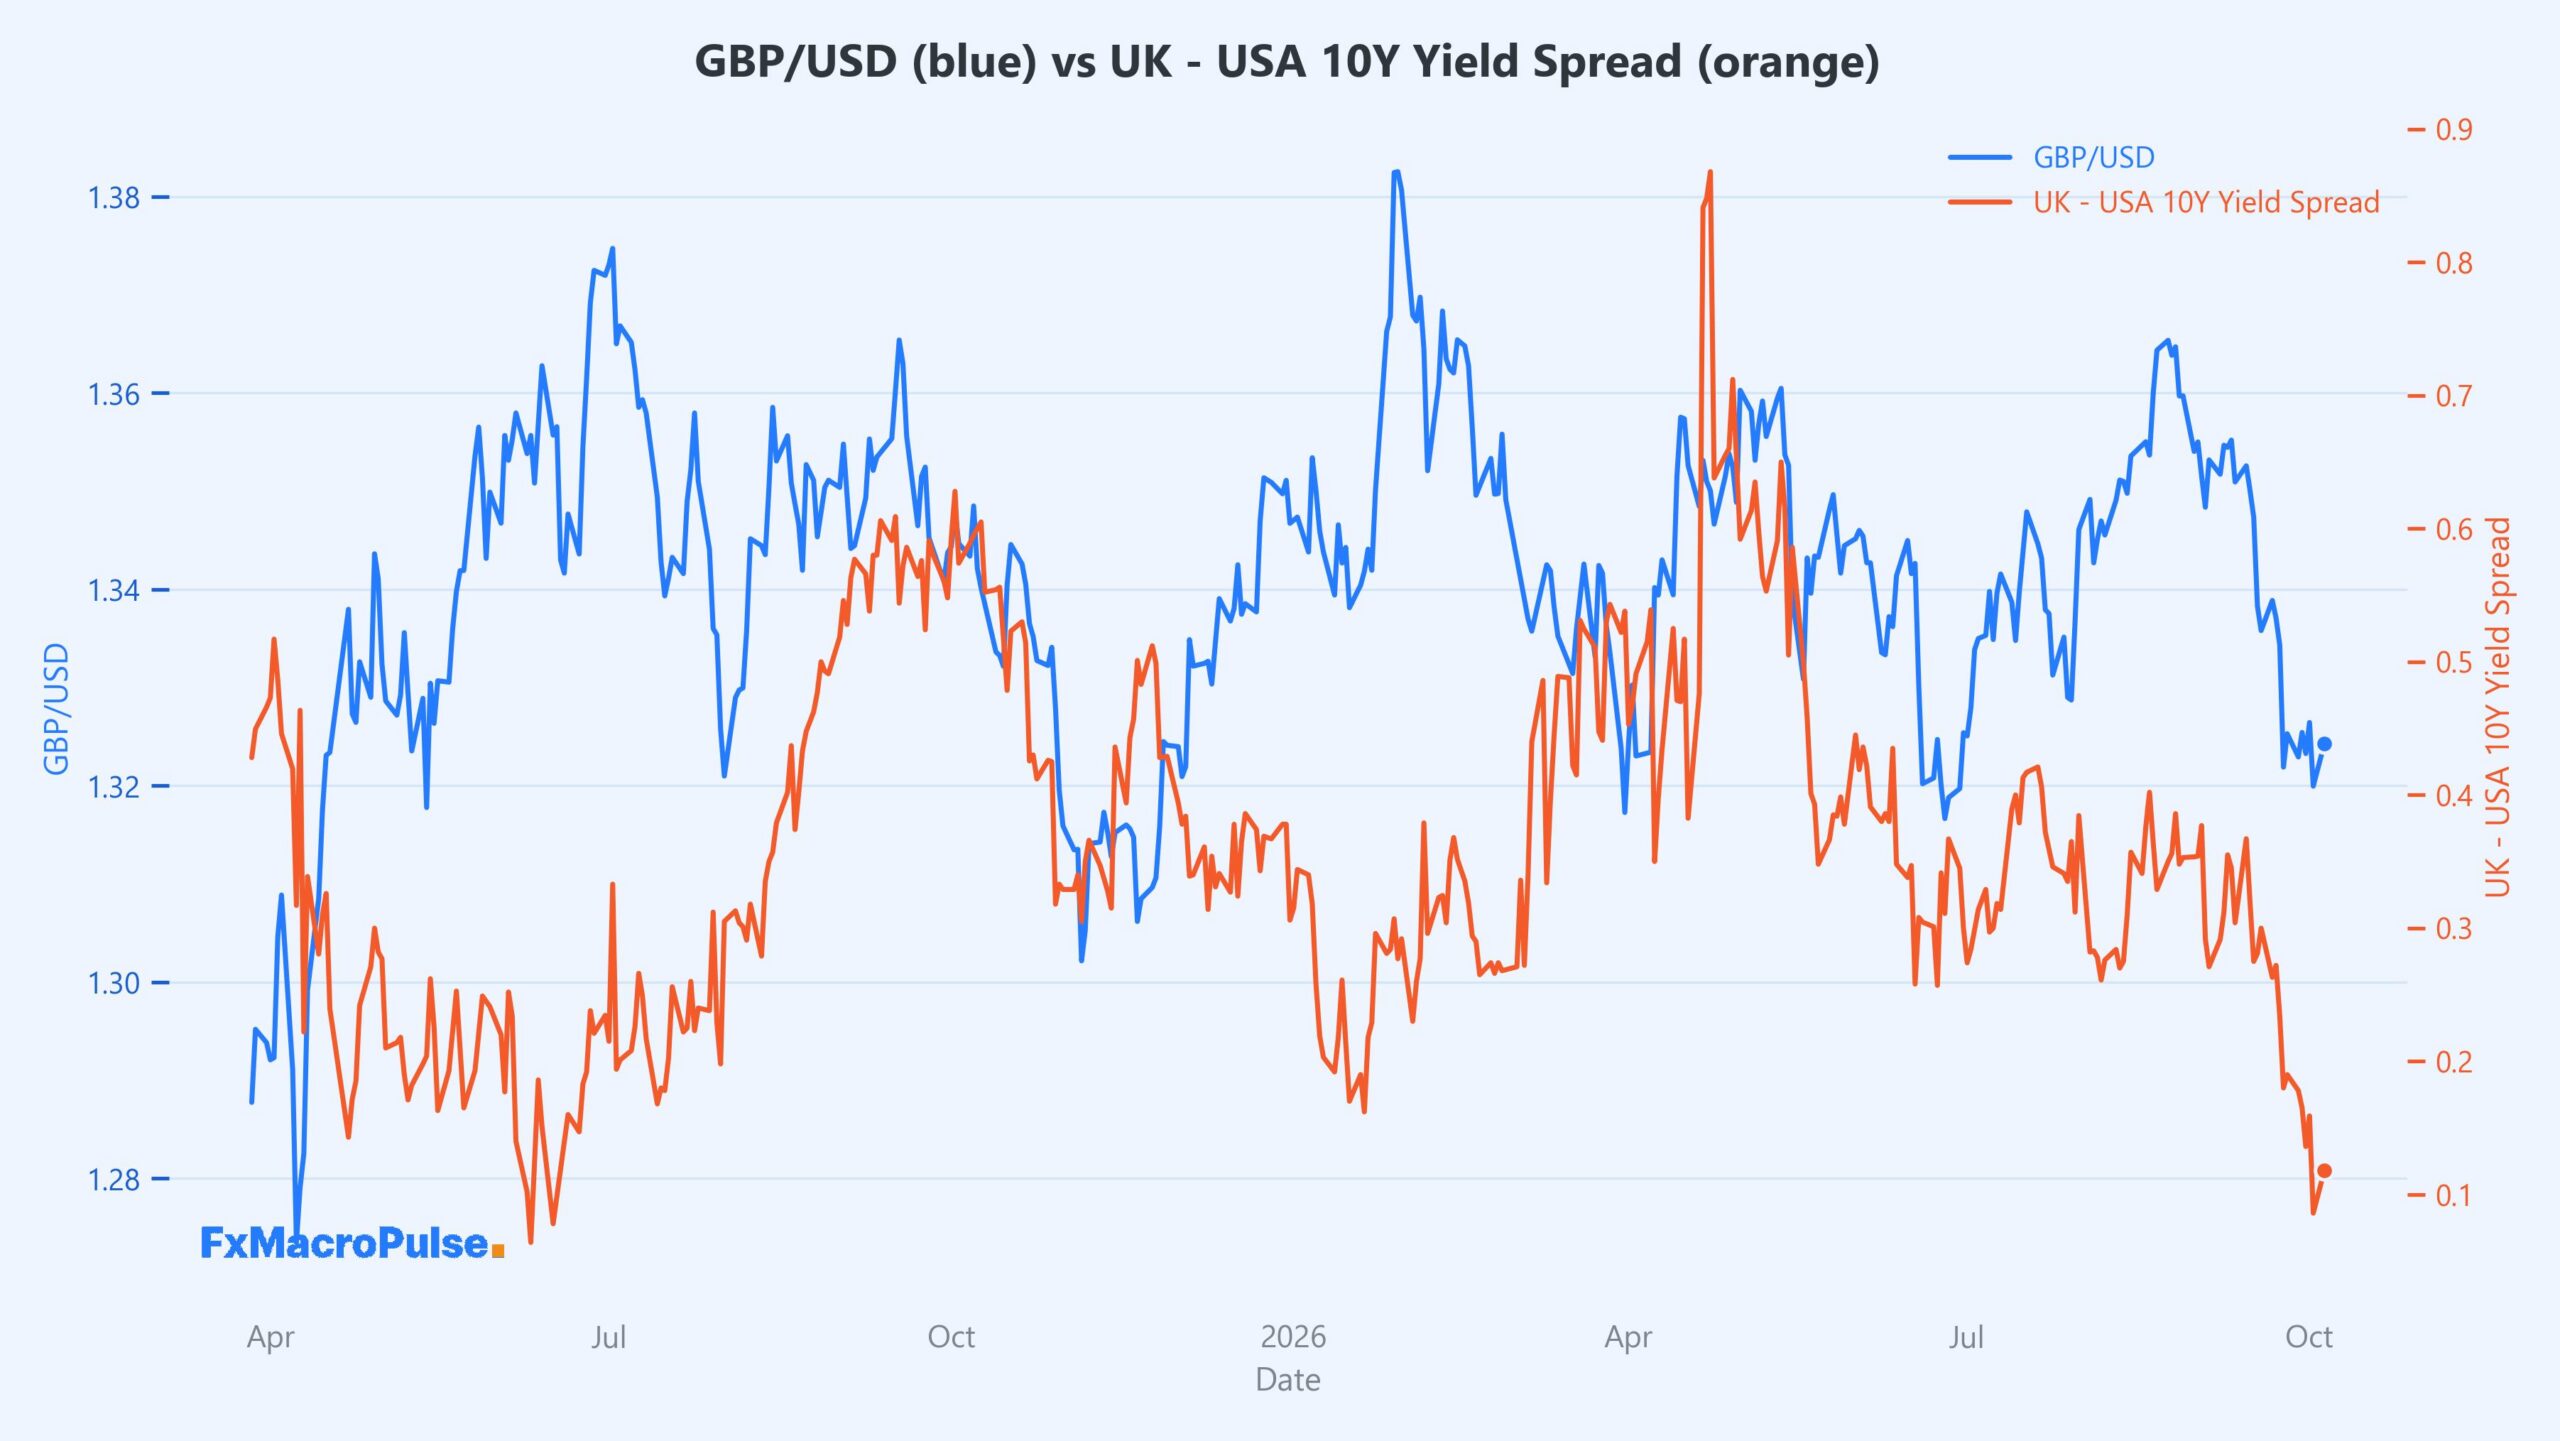
From Aug 21 to Oct 5, MacroFlow fell from 101.264 to 100.808. GBP/USD fell from 1.36435 to 1.32429. Both moved lower, so convergence. From Sep 24 to Oct 5, GBP/USD bounced from 1.3219 to 1.3243 while MacroFlow fell from 100.89 to 100.808. That is a small divergence—GBP steady while MacroFlow slips. Because correlation is weak, this divergence does not give a strong directional edge. It may simply reflect different drivers.
Events ahead could drive daily and weekly volatility. The FOMC Meeting Minutes on Oct 7 (USD, High) and FOMC Member Waller on Oct 8 (USD, Medium) may move USD. BOE Gov Bailey speaks on Oct 8 (GBP, High) and may move GBP. Unemployment Claims on Oct 8 (USD, Medium, forecast 200K vs previous 197K) and Prelim UoM Consumer Sentiment on Oct 9 (USD, Medium, forecast 47.6 vs previous 47.8) also matter. Prelim UoM Inflation Expectations on Oct 9 (USD, Medium, previous 4.6%) could affect Fed outlook. Watch how price reacts at 1.3200 and 1.3300 around these events.
For daily and weekly traders, the daily trend remains corrective, but price sits near support. A weekly close below 1.3200 would keep the bearish structure intact. A break above 1.3300 would challenge the lower-high pattern. MacroFlow’s weak correlation means use it as a secondary check, not a primary signal. Track UK/US stocks ratio and gold for MacroFlow direction. If MacroFlow turns higher with GBP above 1.3300, convergence could support upside. If MacroFlow keeps falling while GBP holds 1.3200, divergence may signal GBP resilience.
COT Analysis
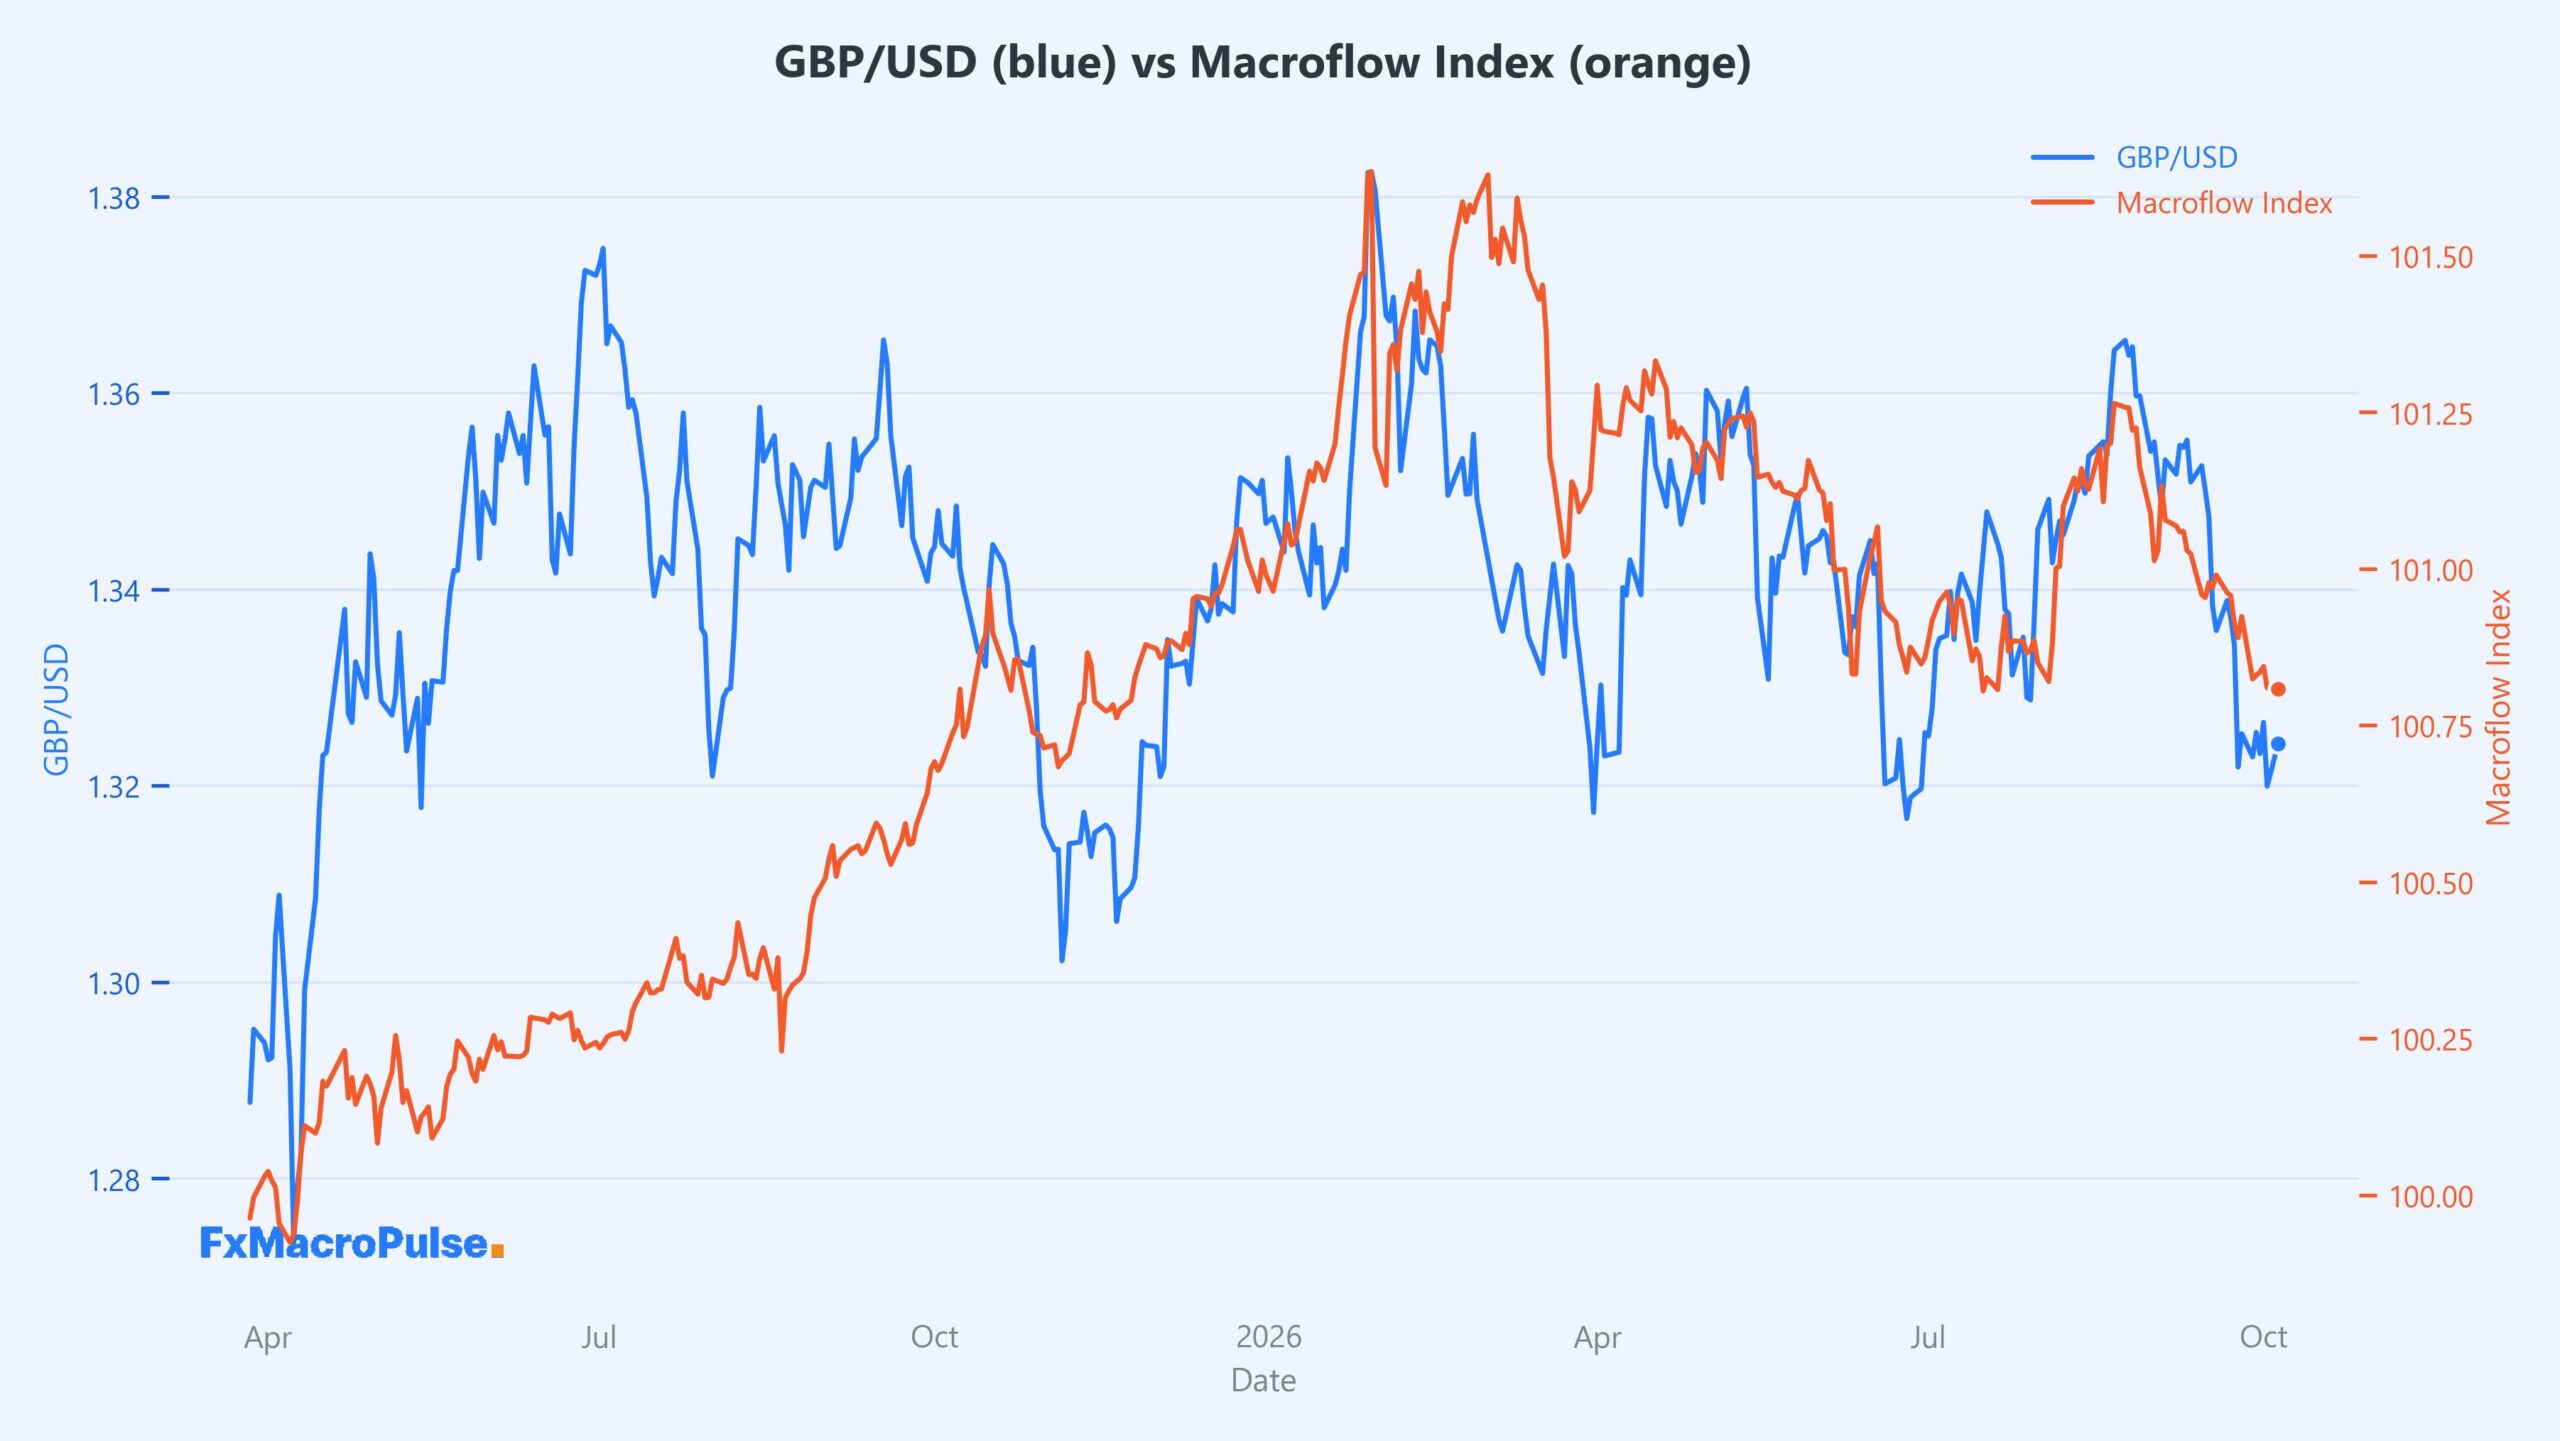
GBP/USD has fallen from around 1.3470 in mid-September to near 1.3200 in early October, making lower daily highs, while the large-trader net-position ratio dropped from about 0.931 to 0.898. Price and this COT gauge moved in the same direction, so they show convergence and a broadly bearish speculative flow behind the daily decline. The ratio has flattened near 0.898 as price stabilizes near 1.32–1.33, so traders can watch for either a fresh ratio breakdown or a rebound that creates divergence.
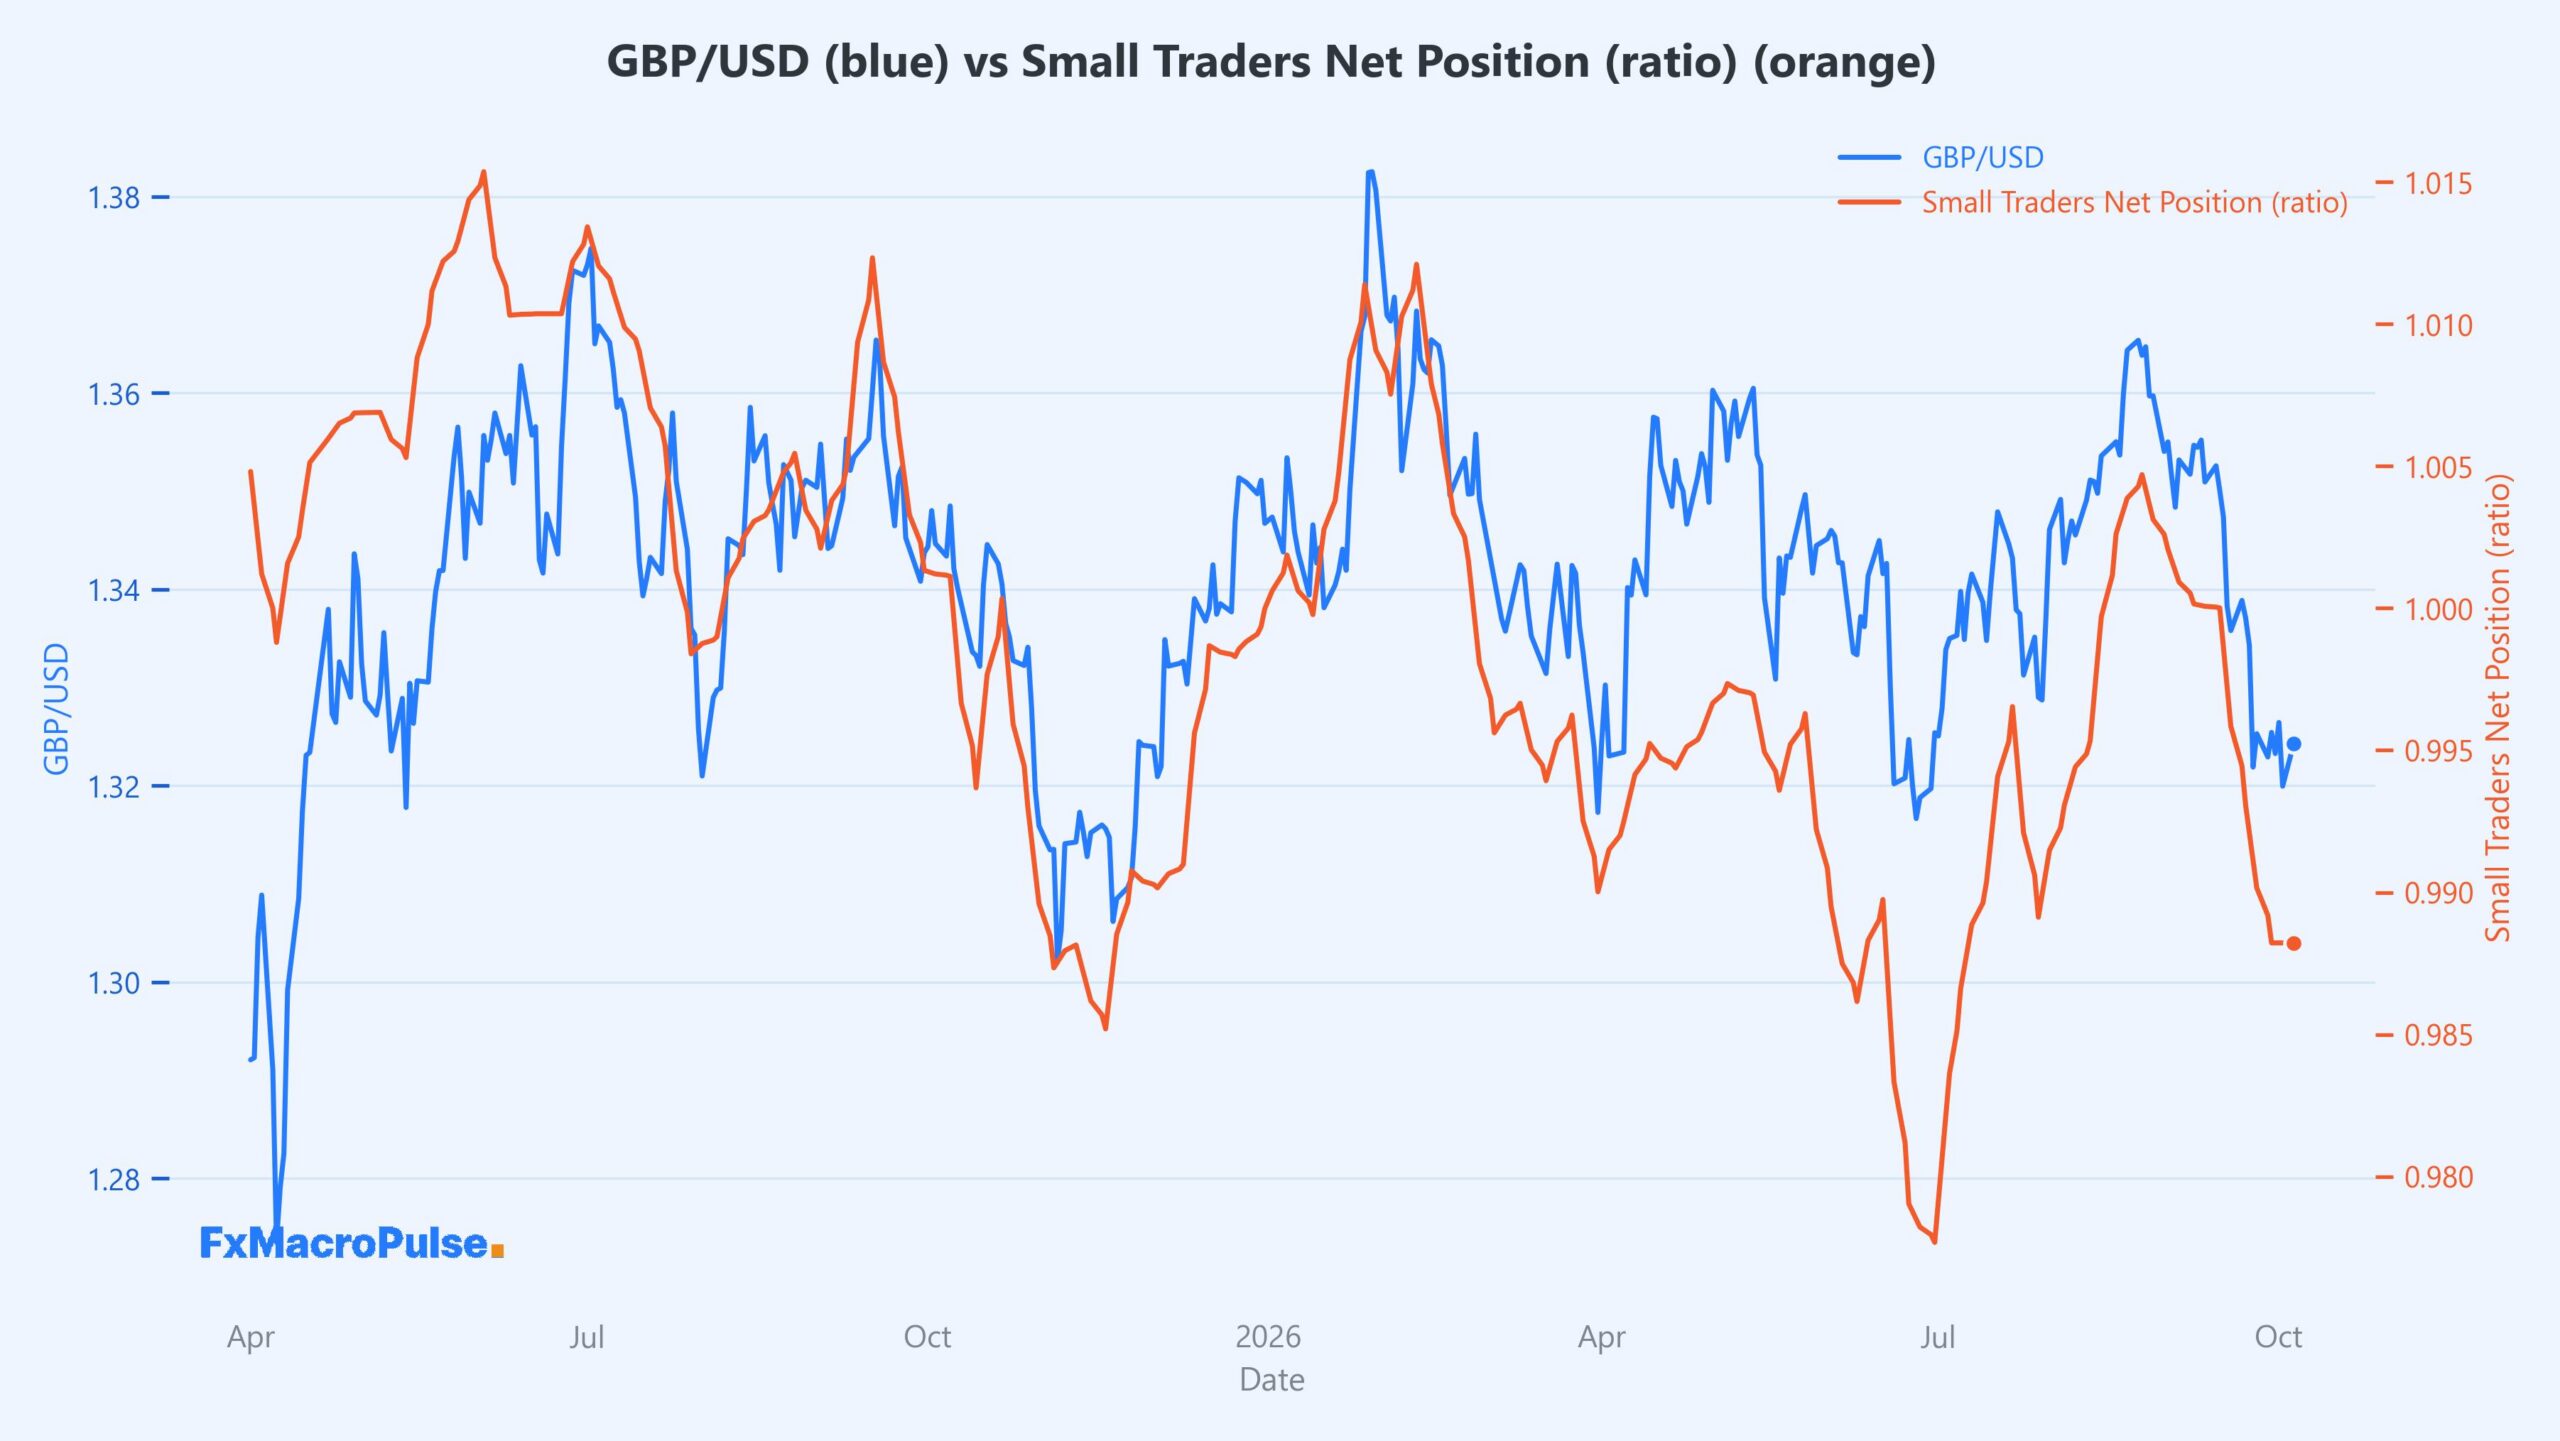
On the daily chart, GBP/USD slipped from a late-August high near 1.365 to about 1.320 by late September, then edged up to 1.324 in early October. The Small Traders Net Position ratio stayed below 1.0 and flattened at 0.9882, so small traders remain net short while price tries to stabilize. This mild divergence shows the bounce lacks confirmation from retail flow, and the weekly picture still looks range-bound between roughly 1.31 and 1.37. Traders may watch whether the ratio climbs back above 1.0 alongside a daily close above 1.33, while macro drivers like UK/US rate expectations and risk sentiment continue to shape any range break.
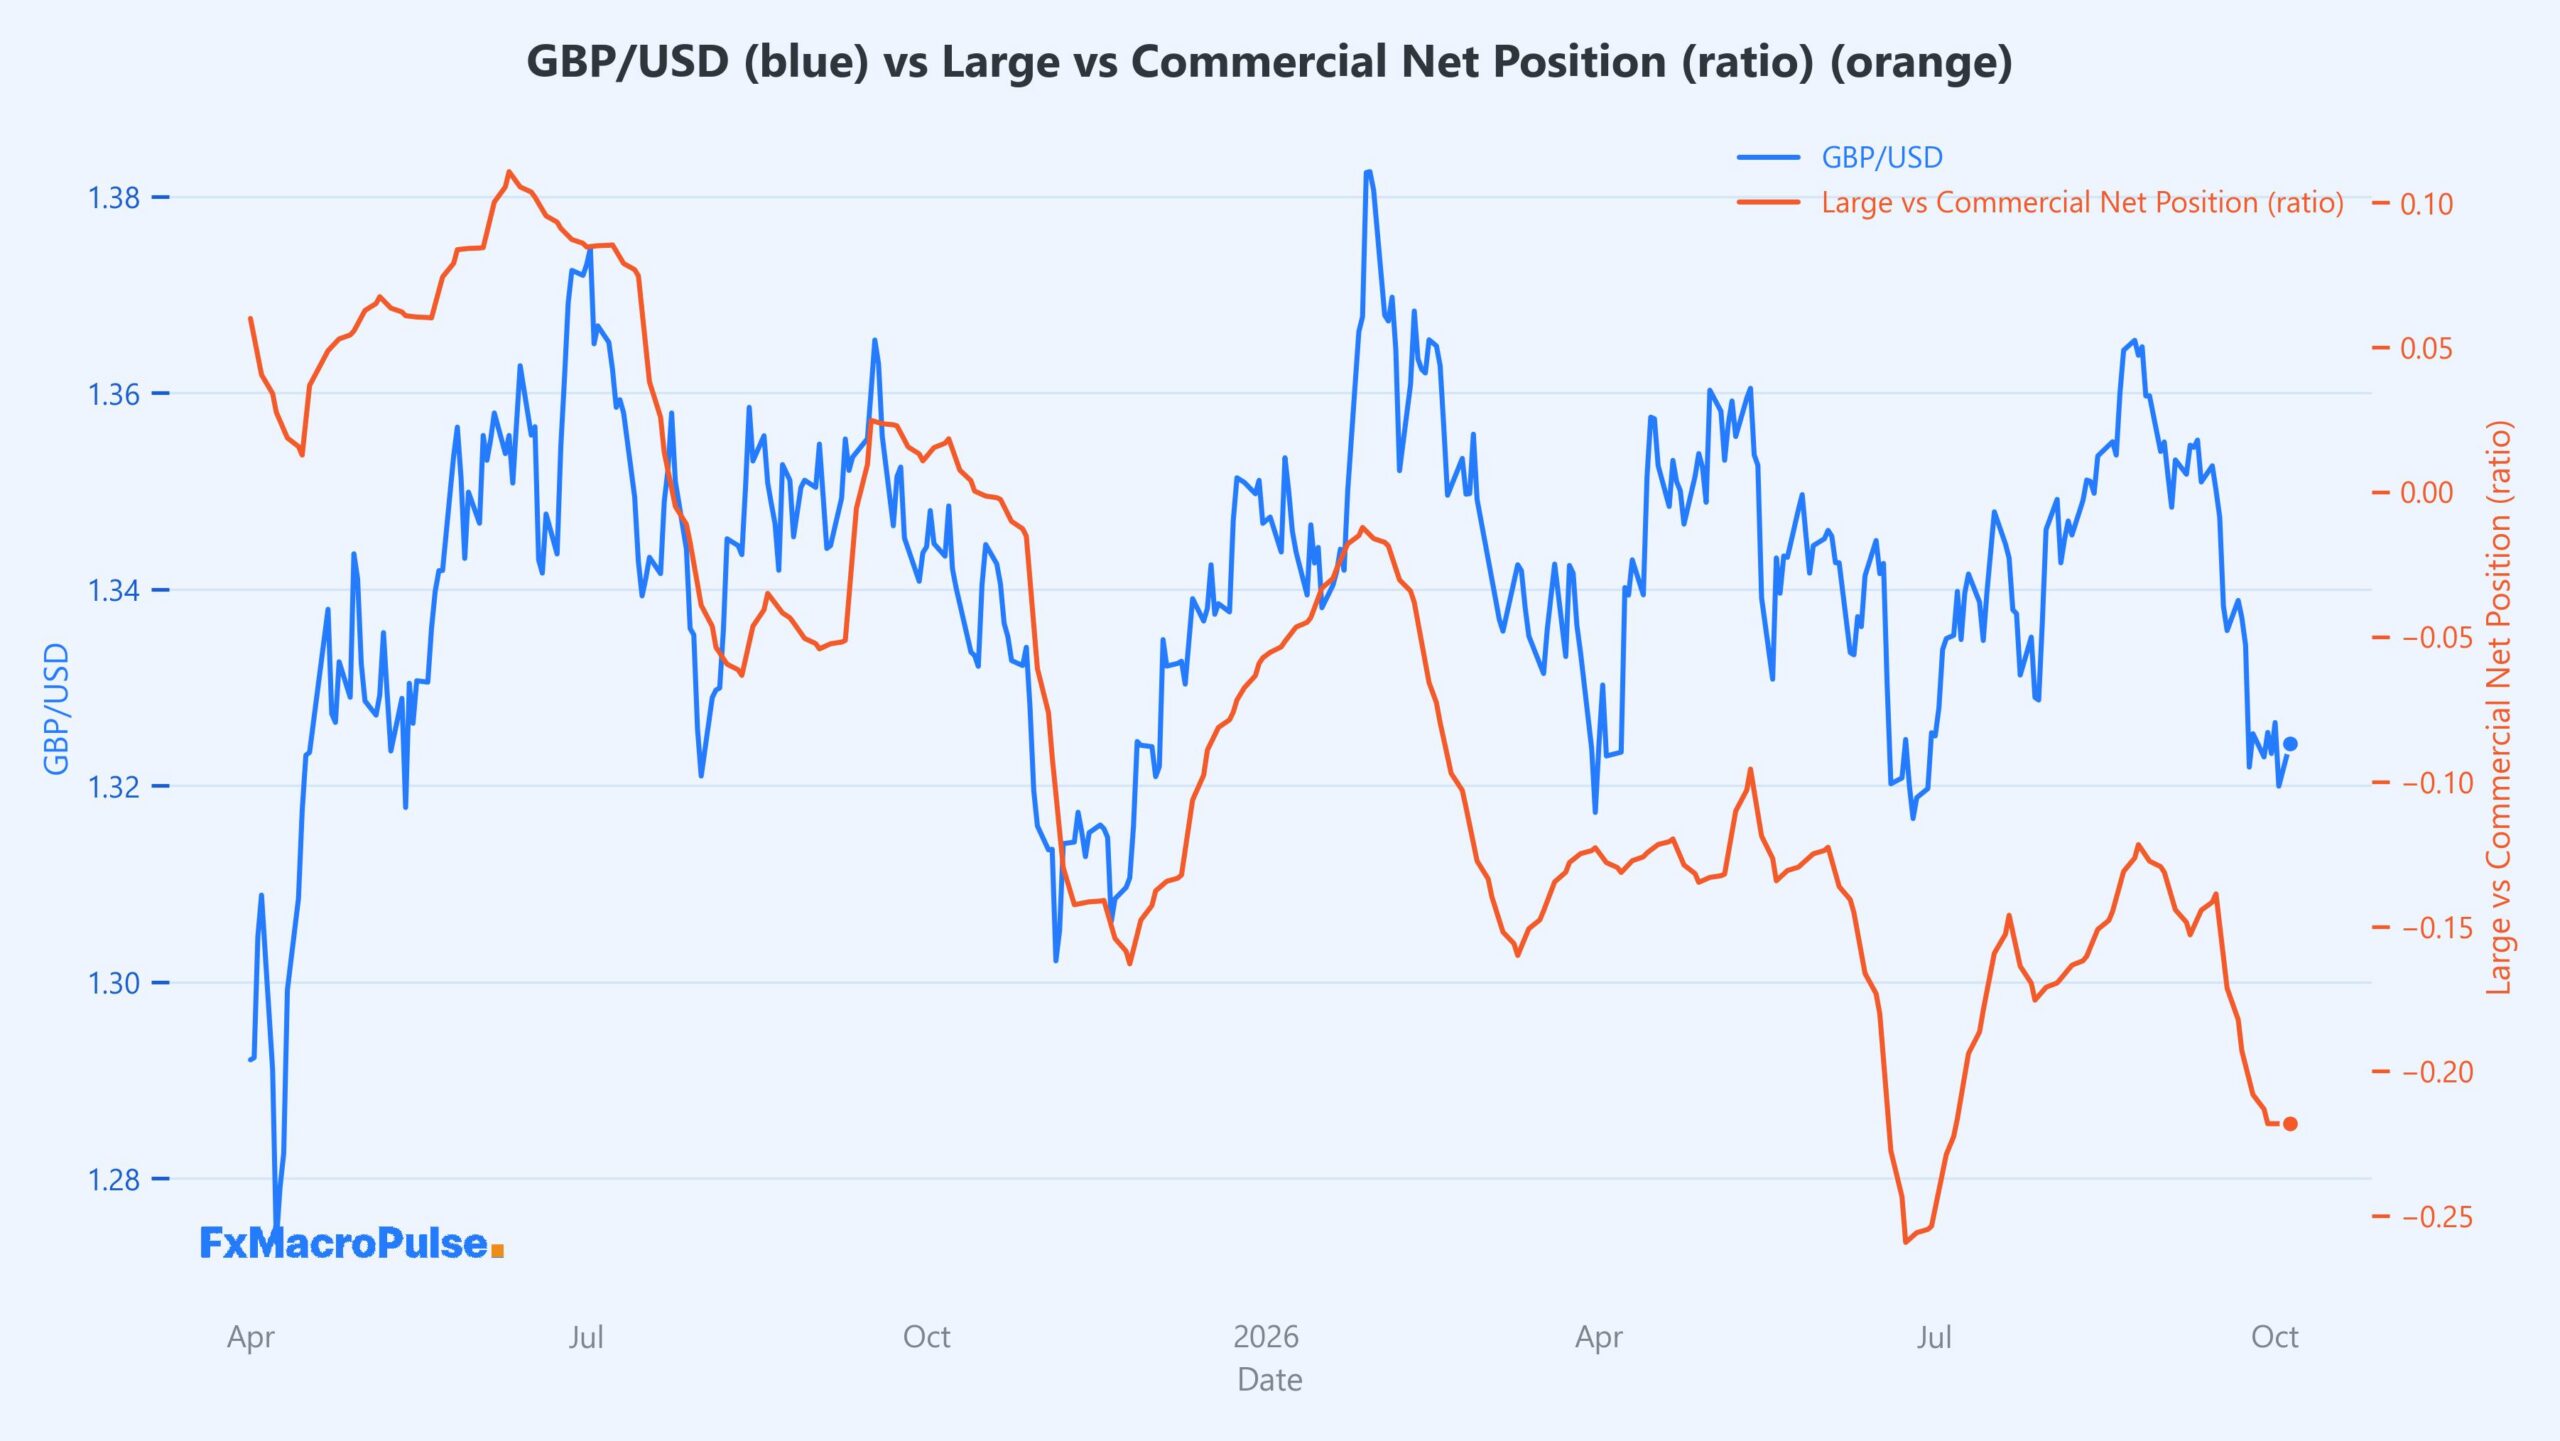
GBP/USD has made lower highs on the daily and weekly charts since late August, sliding from about 1.365 to near 1.320 in early October. The large-vs-commercial net position spread mostly converged with that drop, falling from roughly -0.13 in late August to -0.218 by late September, showing large speculators growing more bearish while commercials lean the other way. The spread then held flat at -0.218 even as price edged up to 1.3243, creating a short-term divergence between a still-bearish COT reading and a small price bounce. This positioning gap remains a key macro-sentiment signal: daily and weekly traders see bearish money flow still aligned with the broader downtrend, while the latest flat reading and minor rebound do not confirm a reversal.
News and Geopolitics
The GBP/USD outlook holds a Slightly Bearish bias, with Low uncertainty, as three drivers tilt the balance: UK budget and gilt credibility risk set against US midterm yield support, Middle East energy-shock safe-haven asymmetry, and transatlantic trade fragmentation alongside European fiscal divergence. The offsetting bullish factor—a UK-EU diplomatic reset—remains constructive but its near-term impact depends on USD dynamics, and the November summit or the October 28 Budget could each deliver two-way surprises. Key swing factors to watch are the gilt-Treasury spread, Hormuz and Brent crude developments, and US midterm polling, along with any joint UK-EU statement from the November summit.