Macro Analysis
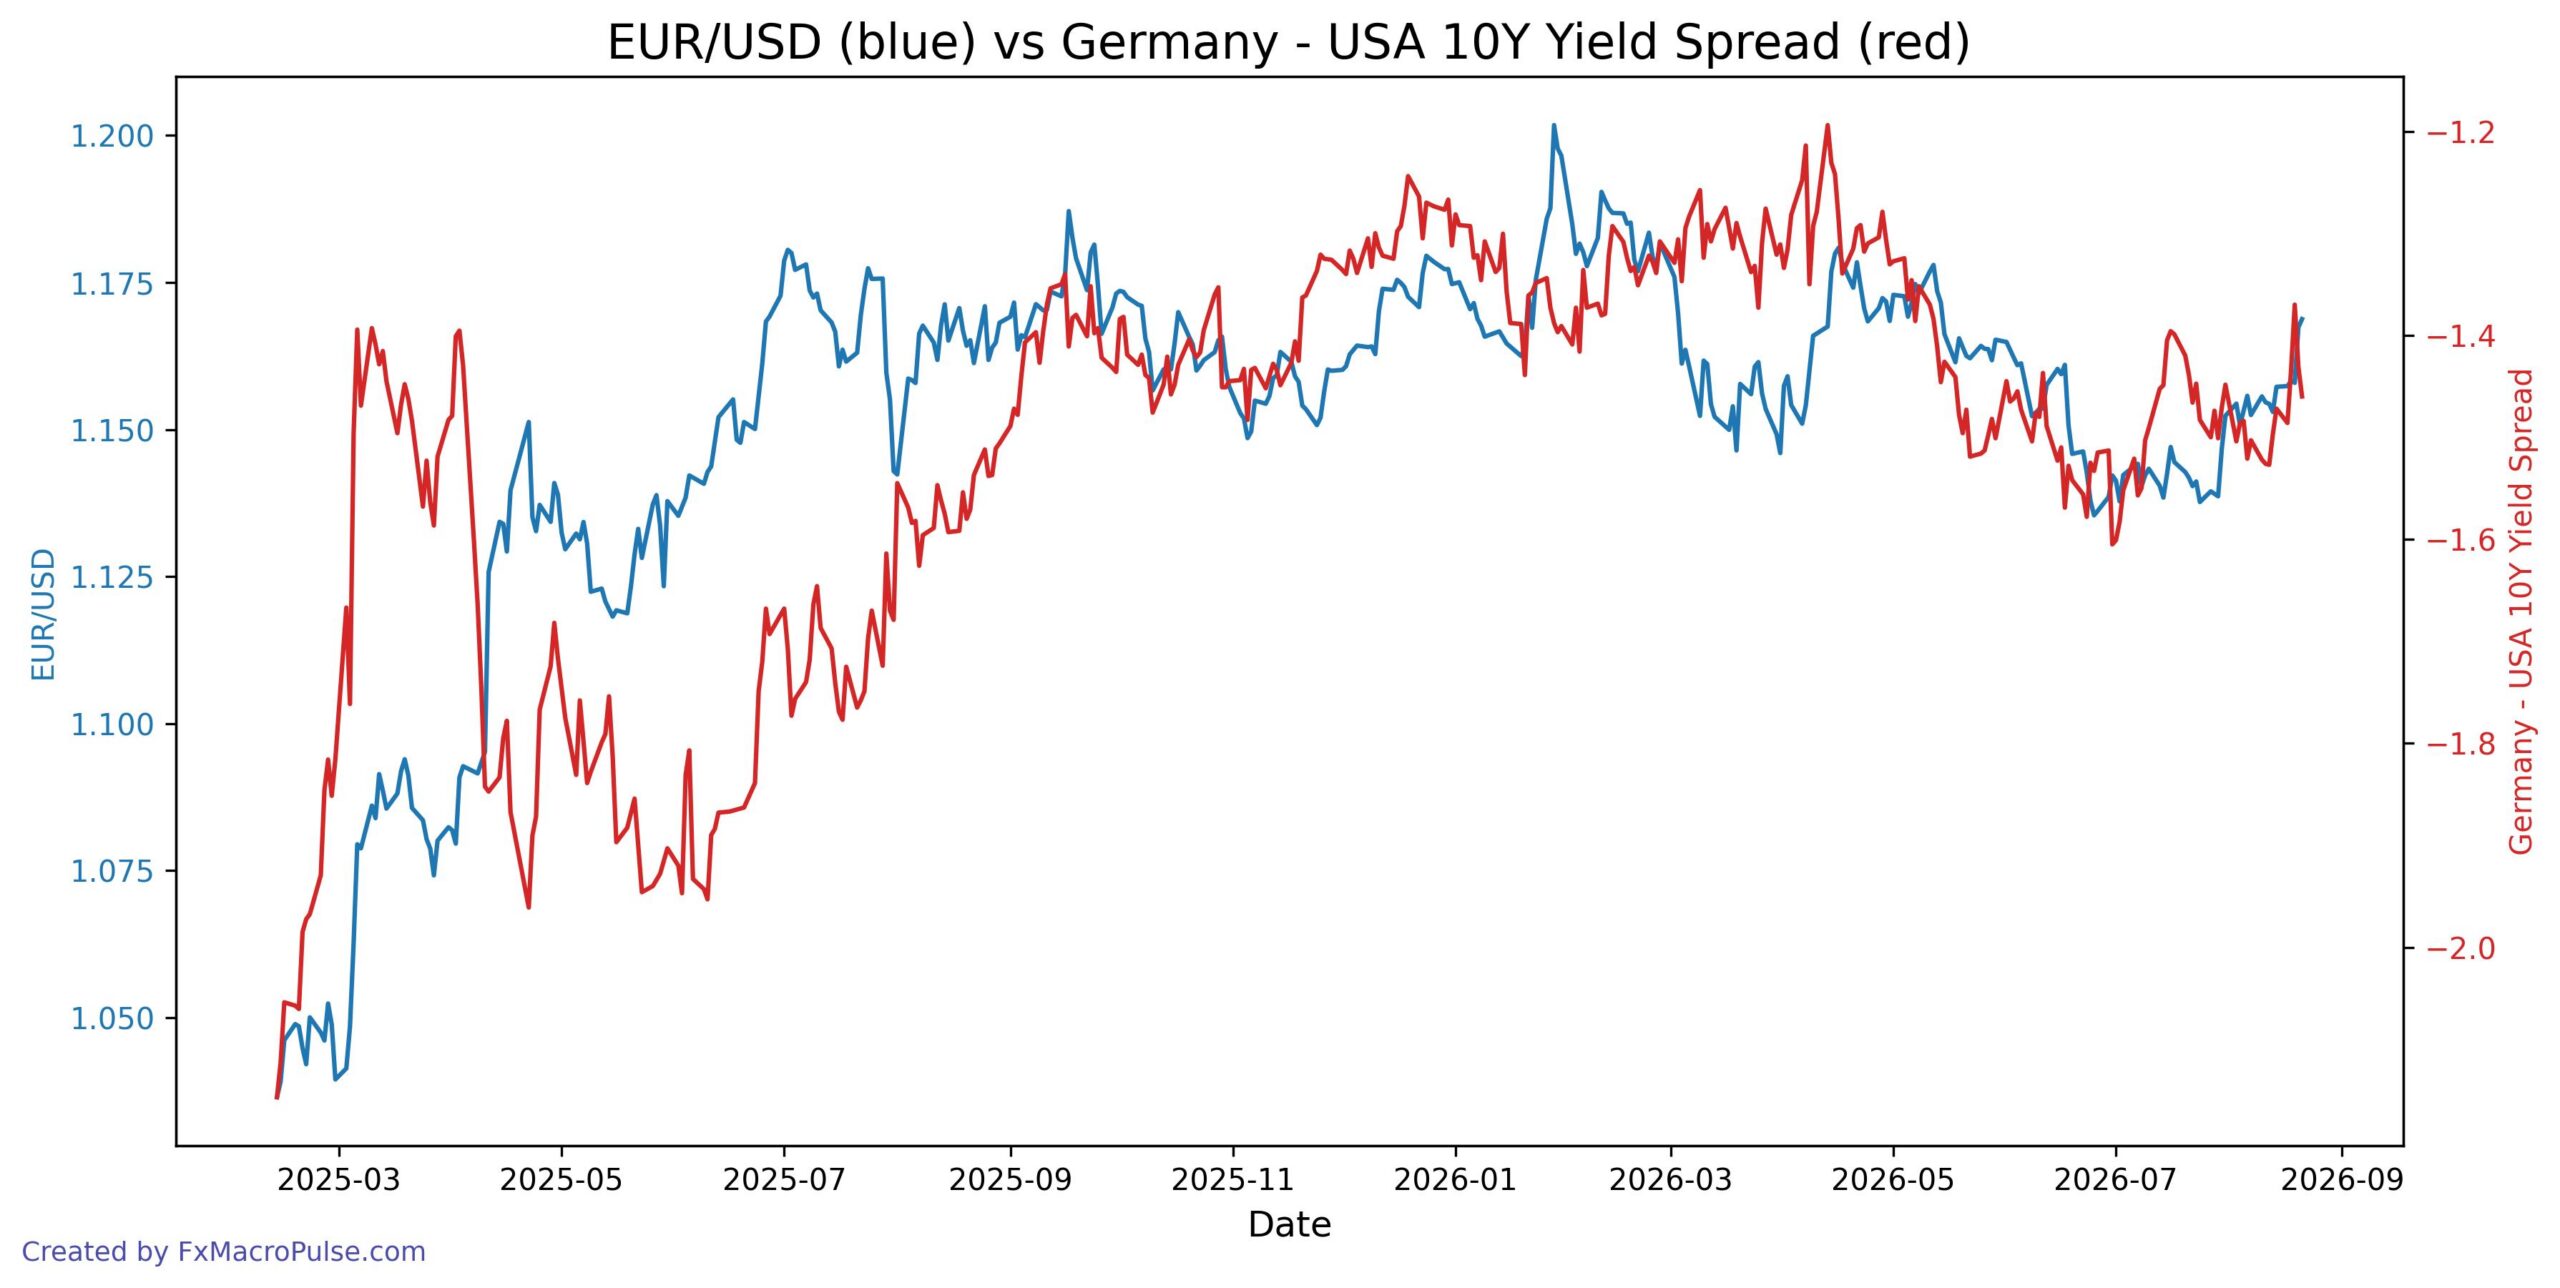
The MacroFlow Index is a proprietary index created to track the pair’s fundamentals, and tracks the following: Germany/US 10Y Gov. Yield Spread, Germany/US Stocks Index Ratio, Gold Futures. Its historical correlation with EUR/USD is 0.63, but the past two weeks show a clear divergence between price and this fundamental composite.
On the daily chart, EUR/USD traded sideways between roughly 1.1530 and 1.1585 from August 10 to August 19. Then the pair jumped from 1.15794 on August 19 to 1.16738 on August 20, and followed through to 1.16878 on August 21. That breakout gave the daily chart a bullish tone and produced the strongest weekly close since mid-May.
The MacroFlow Index did not confirm this move. It slipped from 99.607 on August 13 to 99.547 on August 14, and then stayed flat at 99.547 through August 21. So while EUR/USD rallied, the MacroFlow Index moved sideways and slightly lower. This is a textbook divergence on both the daily and weekly timeframes.
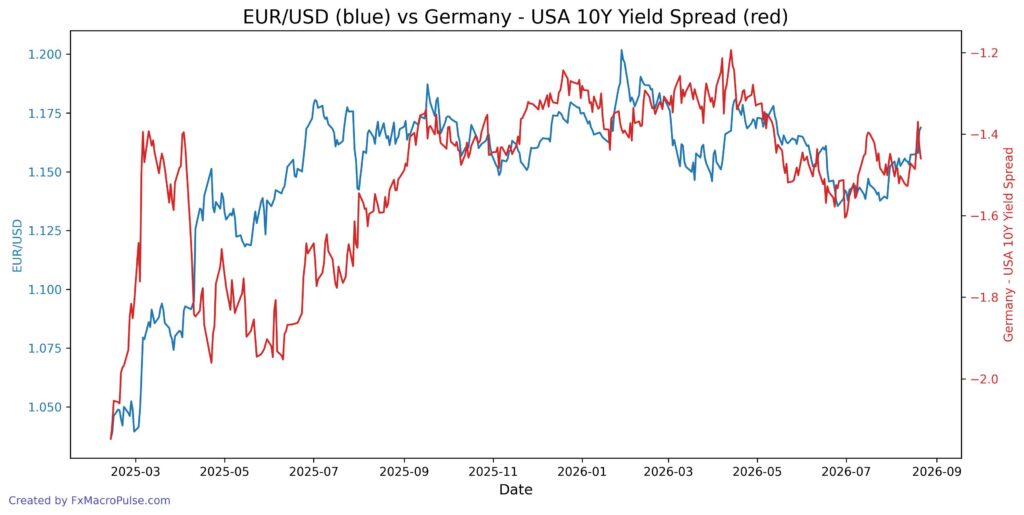
Looking at one component, the Germany/US 10Y yield spread did improve in the middle of the rally, moving from about -1.50 to -1.37 before settling near -1.46. Since the MacroFlow Index stayed flat during that stretch, the stock-ratio and gold components did not add positive momentum.
For traders, the immediate test comes next week. The US calendar includes CB Consumer Confidence on August 25, Core PCE and Prelim GDP on August 26, Unemployment Claims on August 27, and then Fed Chairman Warsh plus the preliminary benchmark payrolls revision on August 28. These events can drive USD volatility and will help show whether EUR/USD can hold its gains while the MacroFlow Index remains flat, or whether the divergence starts to close.
COT Analysis
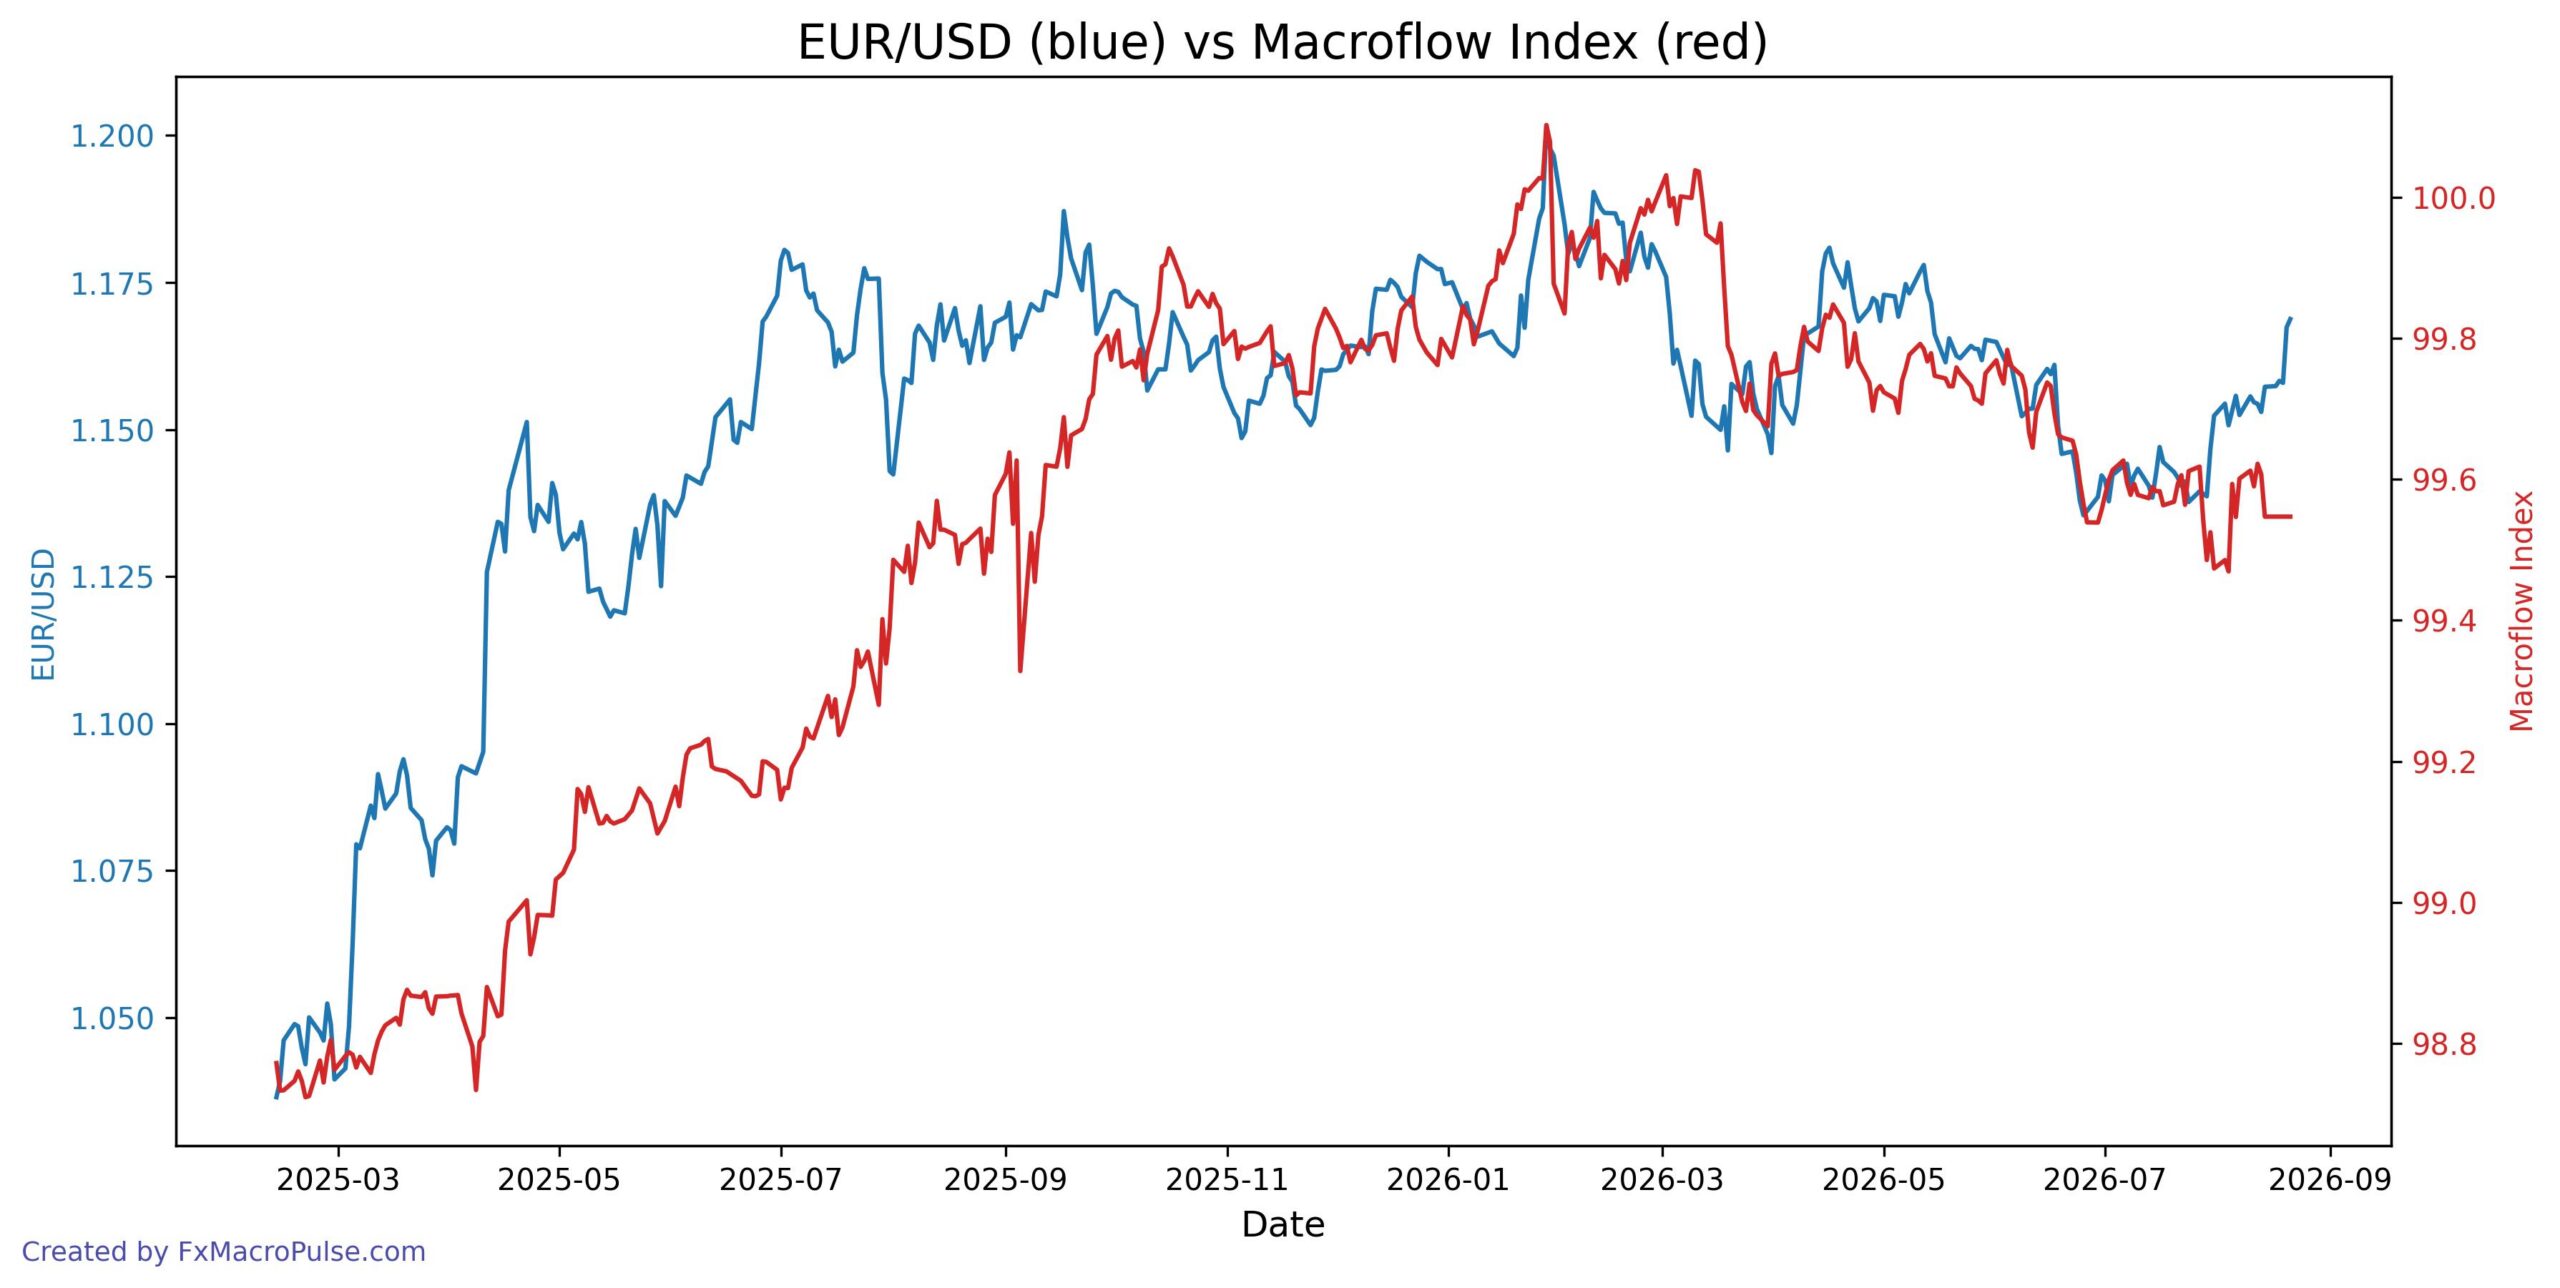
EUR/USD’s daily recovery from late-July lows near 1.138 aligns with a steady rise in the asset manager spread ratio from about 1.18 to 1.219, confirming bullish money flow and a positive convergence on the daily timeframe. In the most recent sessions, however, price extended to 1.169 while the COT ratio flattened at 1.219, creating a mild divergence that suggests institutional buying momentum has paused. On the weekly timeframe, the pair holds above prior consolidation levels, but this cooling in asset-manager flow warrants attention as a sign of reduced commitment at higher prices.
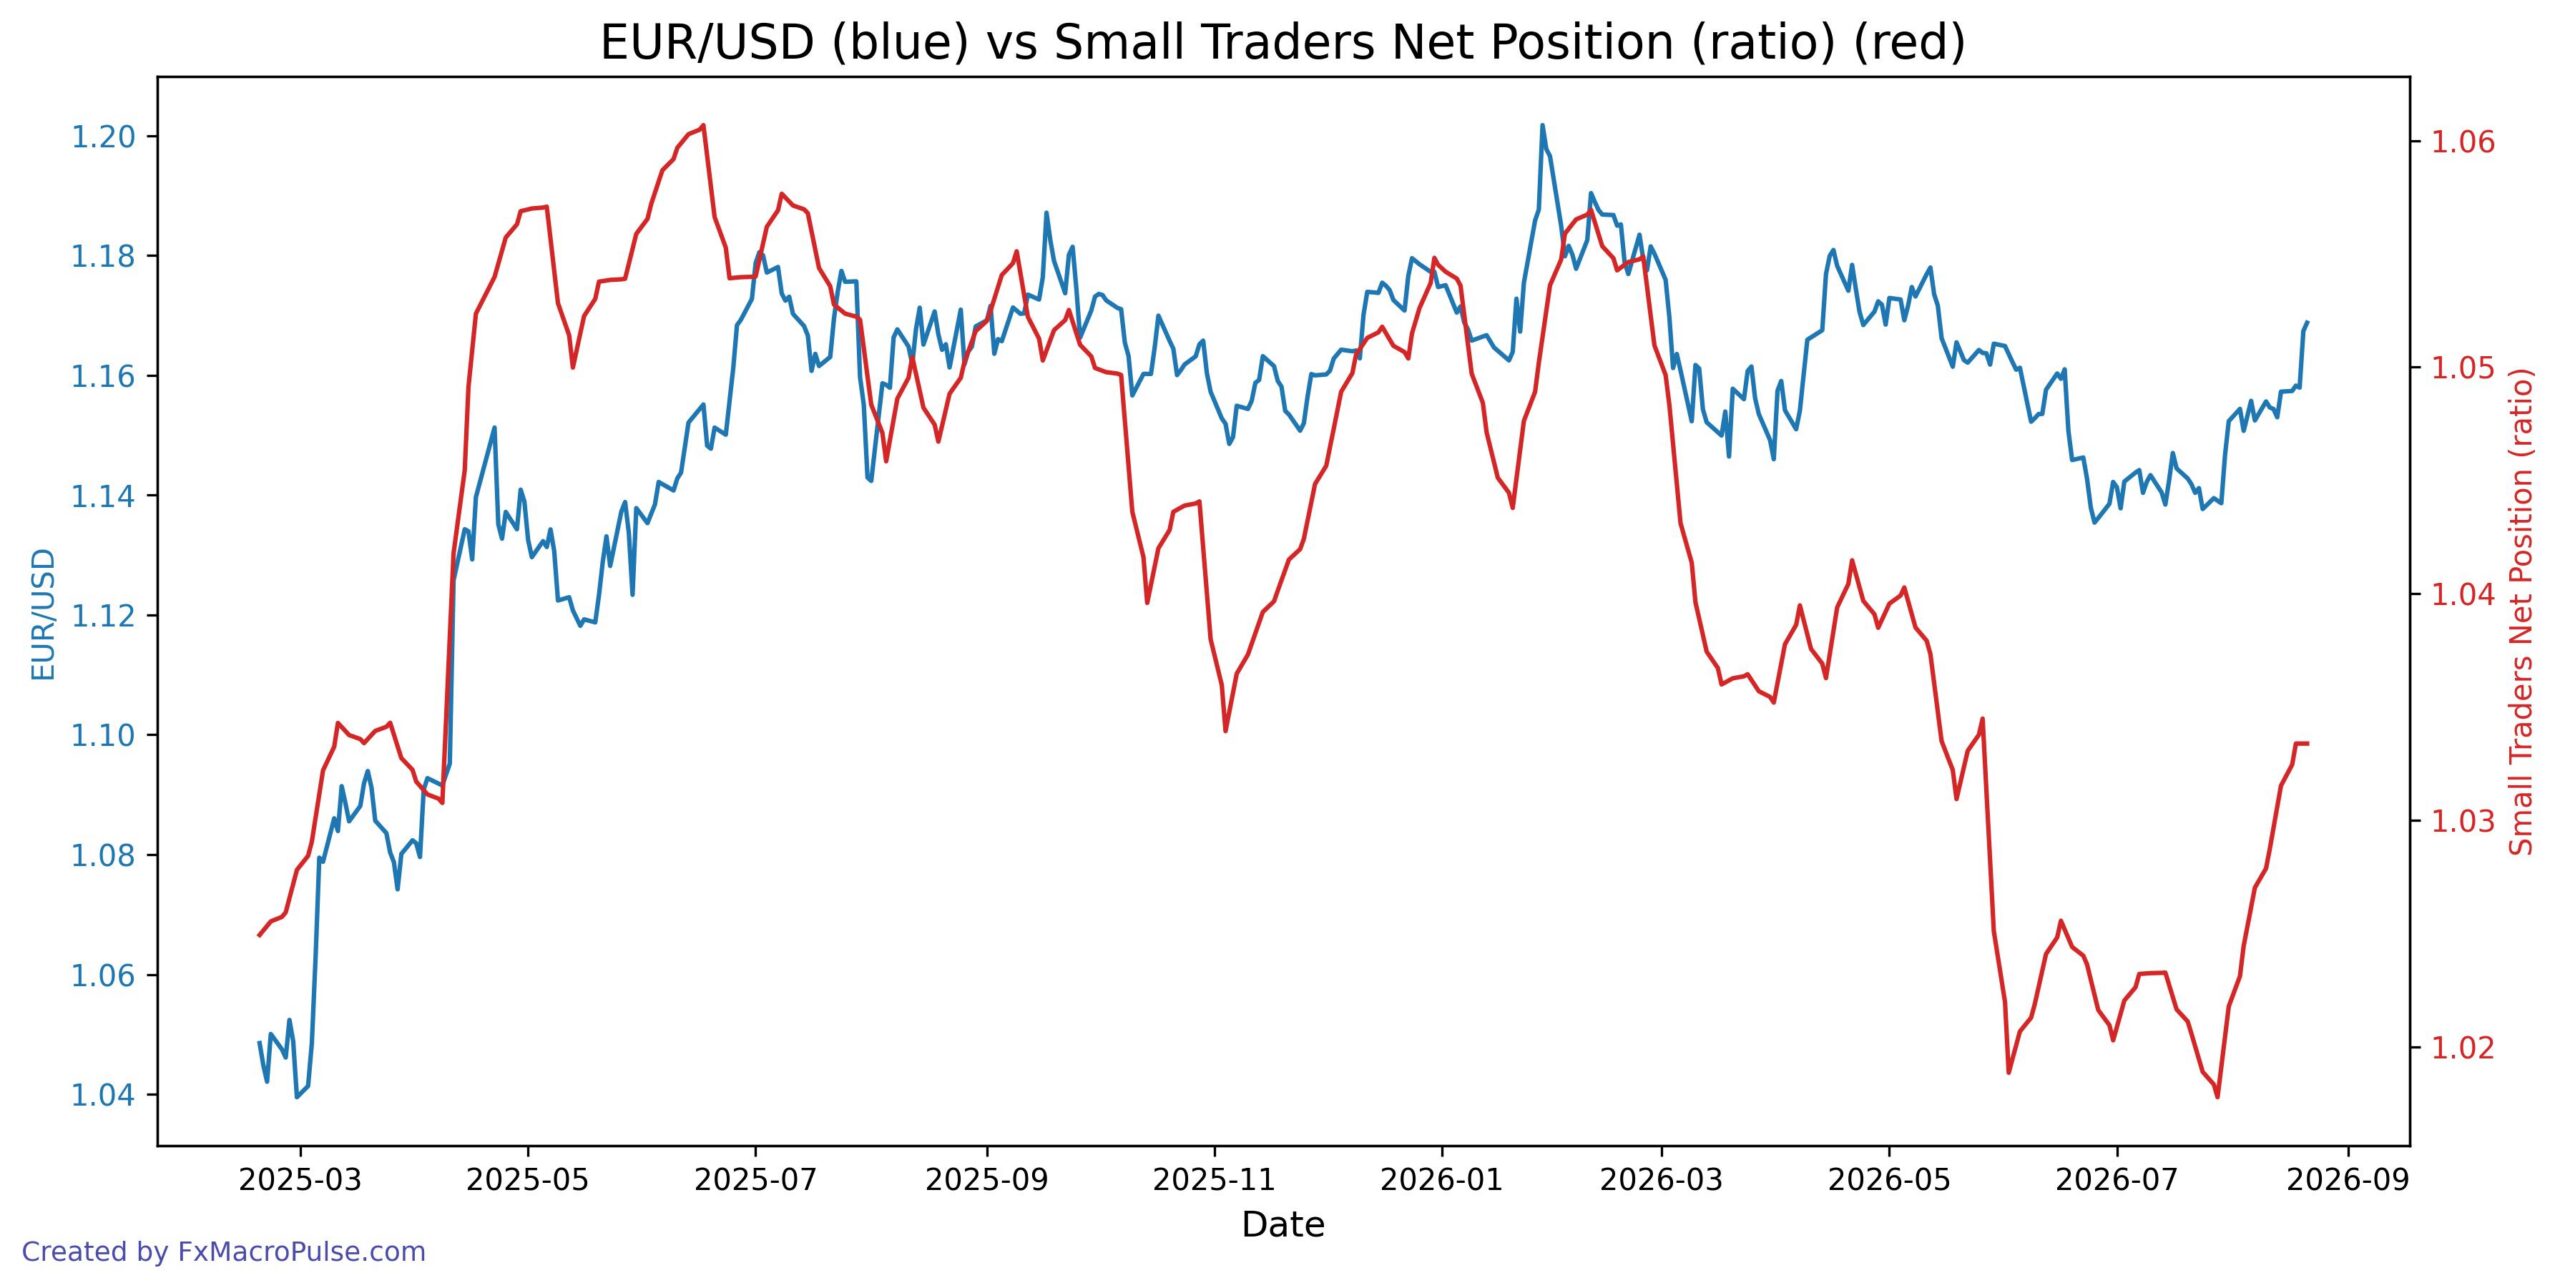
On the daily chart, EUR/USD has built a clear recovery from the 1.1350–1.1400 zone and currently trades near 1.1690, forming higher lows. The Small Traders Net Position ratio rose from roughly 1.018 to 1.033 during this same advance, so price and the COT/money-flow gauge are converging. That alignment suggests improving upside participation, with macro attention still on ECB/Fed policy signals. Resistance around 1.1700 remains the key technical hurdle to watch.
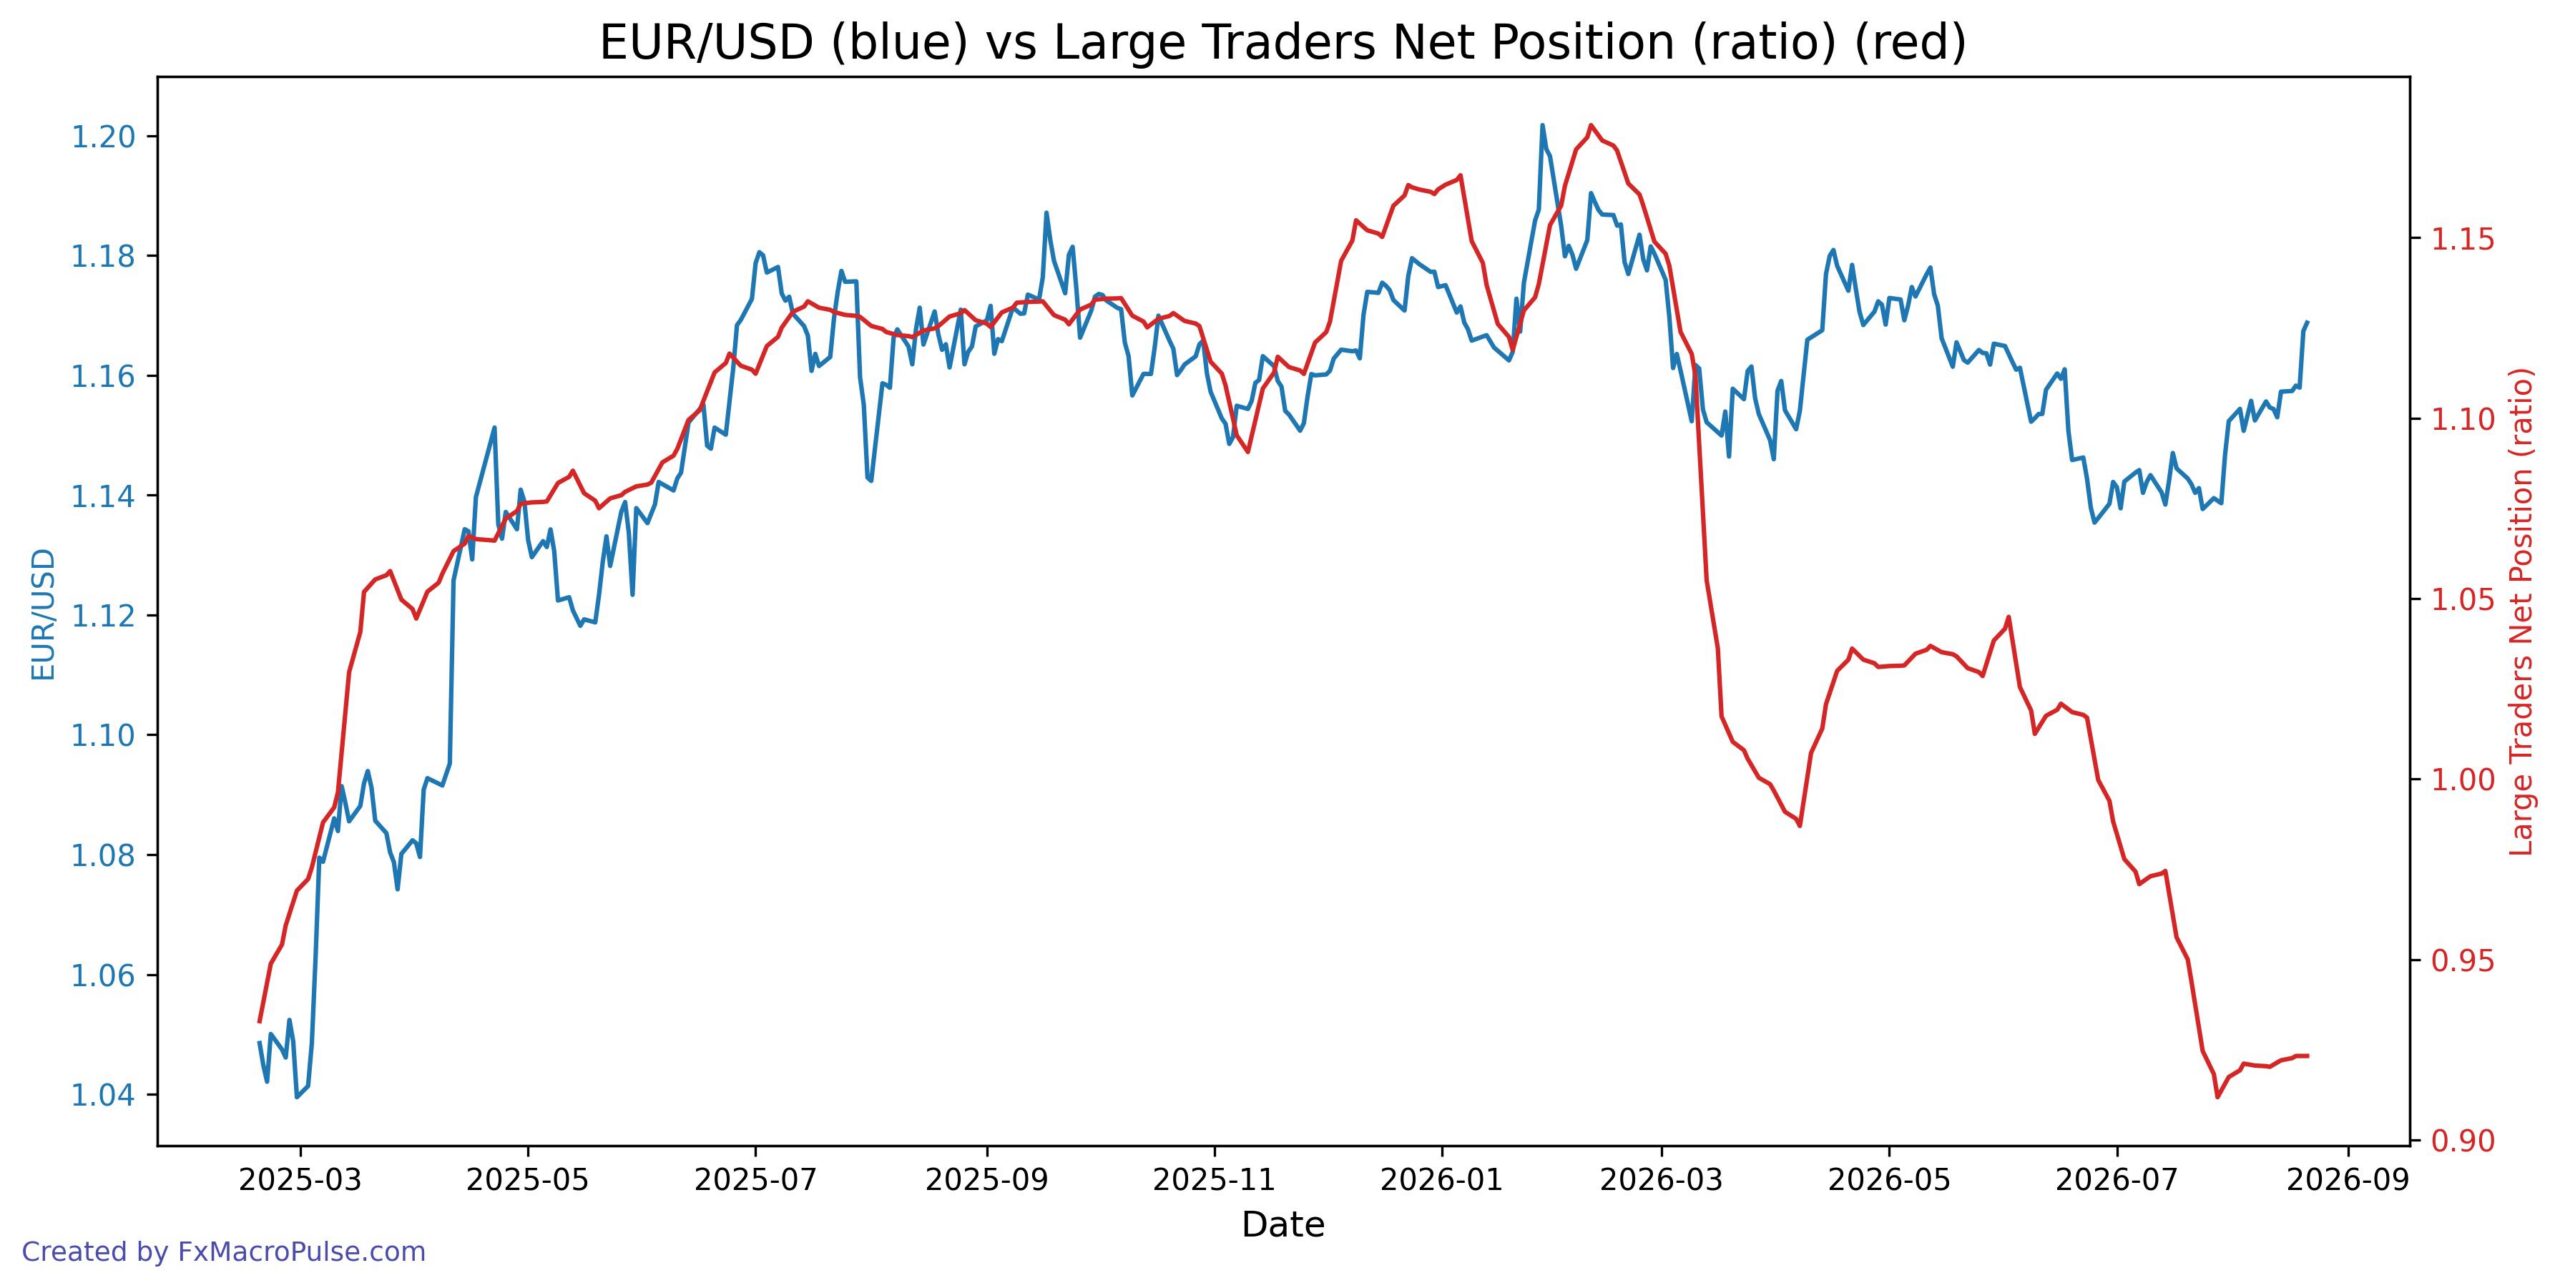
EUR/USD has rebounded on the daily chart, rising from roughly 1.139 in late July to 1.169 by August 21. The COT large-trader net position ratio bottomed near 0.912 and now sits around 0.923, so the initial bounce showed convergence, but the latest price strength is diverging from flat sentiment. This divergence suggests the rally lacks fresh speculative buying support, and on the weekly timeframe the pair still trades below its January 2026 high near 1.202.
News and Geopolitics
The geopolitical backdrop for EUR/USD remains bearish, fueled by a stagflationary energy shock emanating from the Strait of Hormuz, alongside escalating US-EU tariff tensions and persistent French fiscal fragility. Global trade fragmentation continues to weigh on the single currency, with the overall low uncertainty surrounding this outlook allowing the market to price in the current risk premium with relative stability. A de-escalation in the Gulf or a delay in tariff enforcement would be required to alter this trajectory, though neither appears imminent at this stage.