Macro Analysis
GBP/USD: Yield Spread Diverges, But Price Breaks Support – What Traders Need to Know
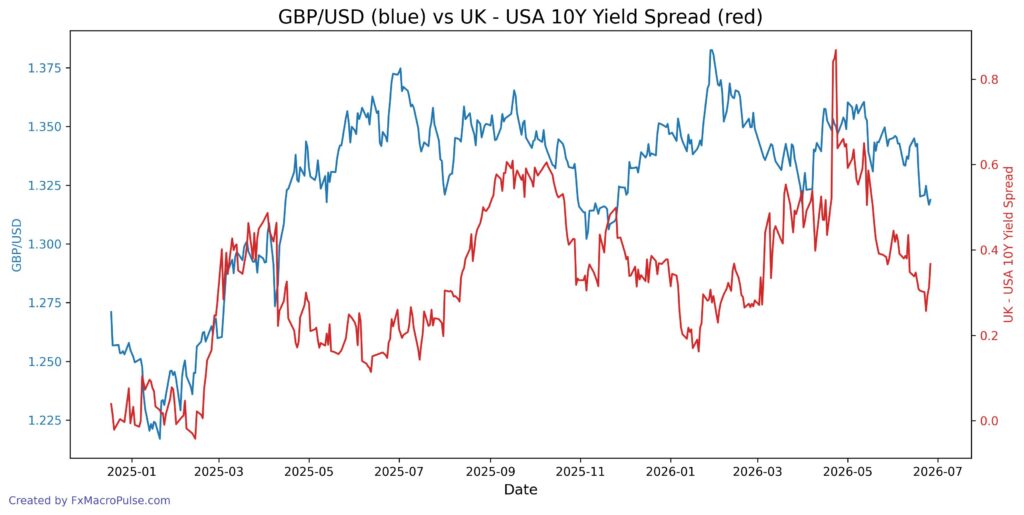
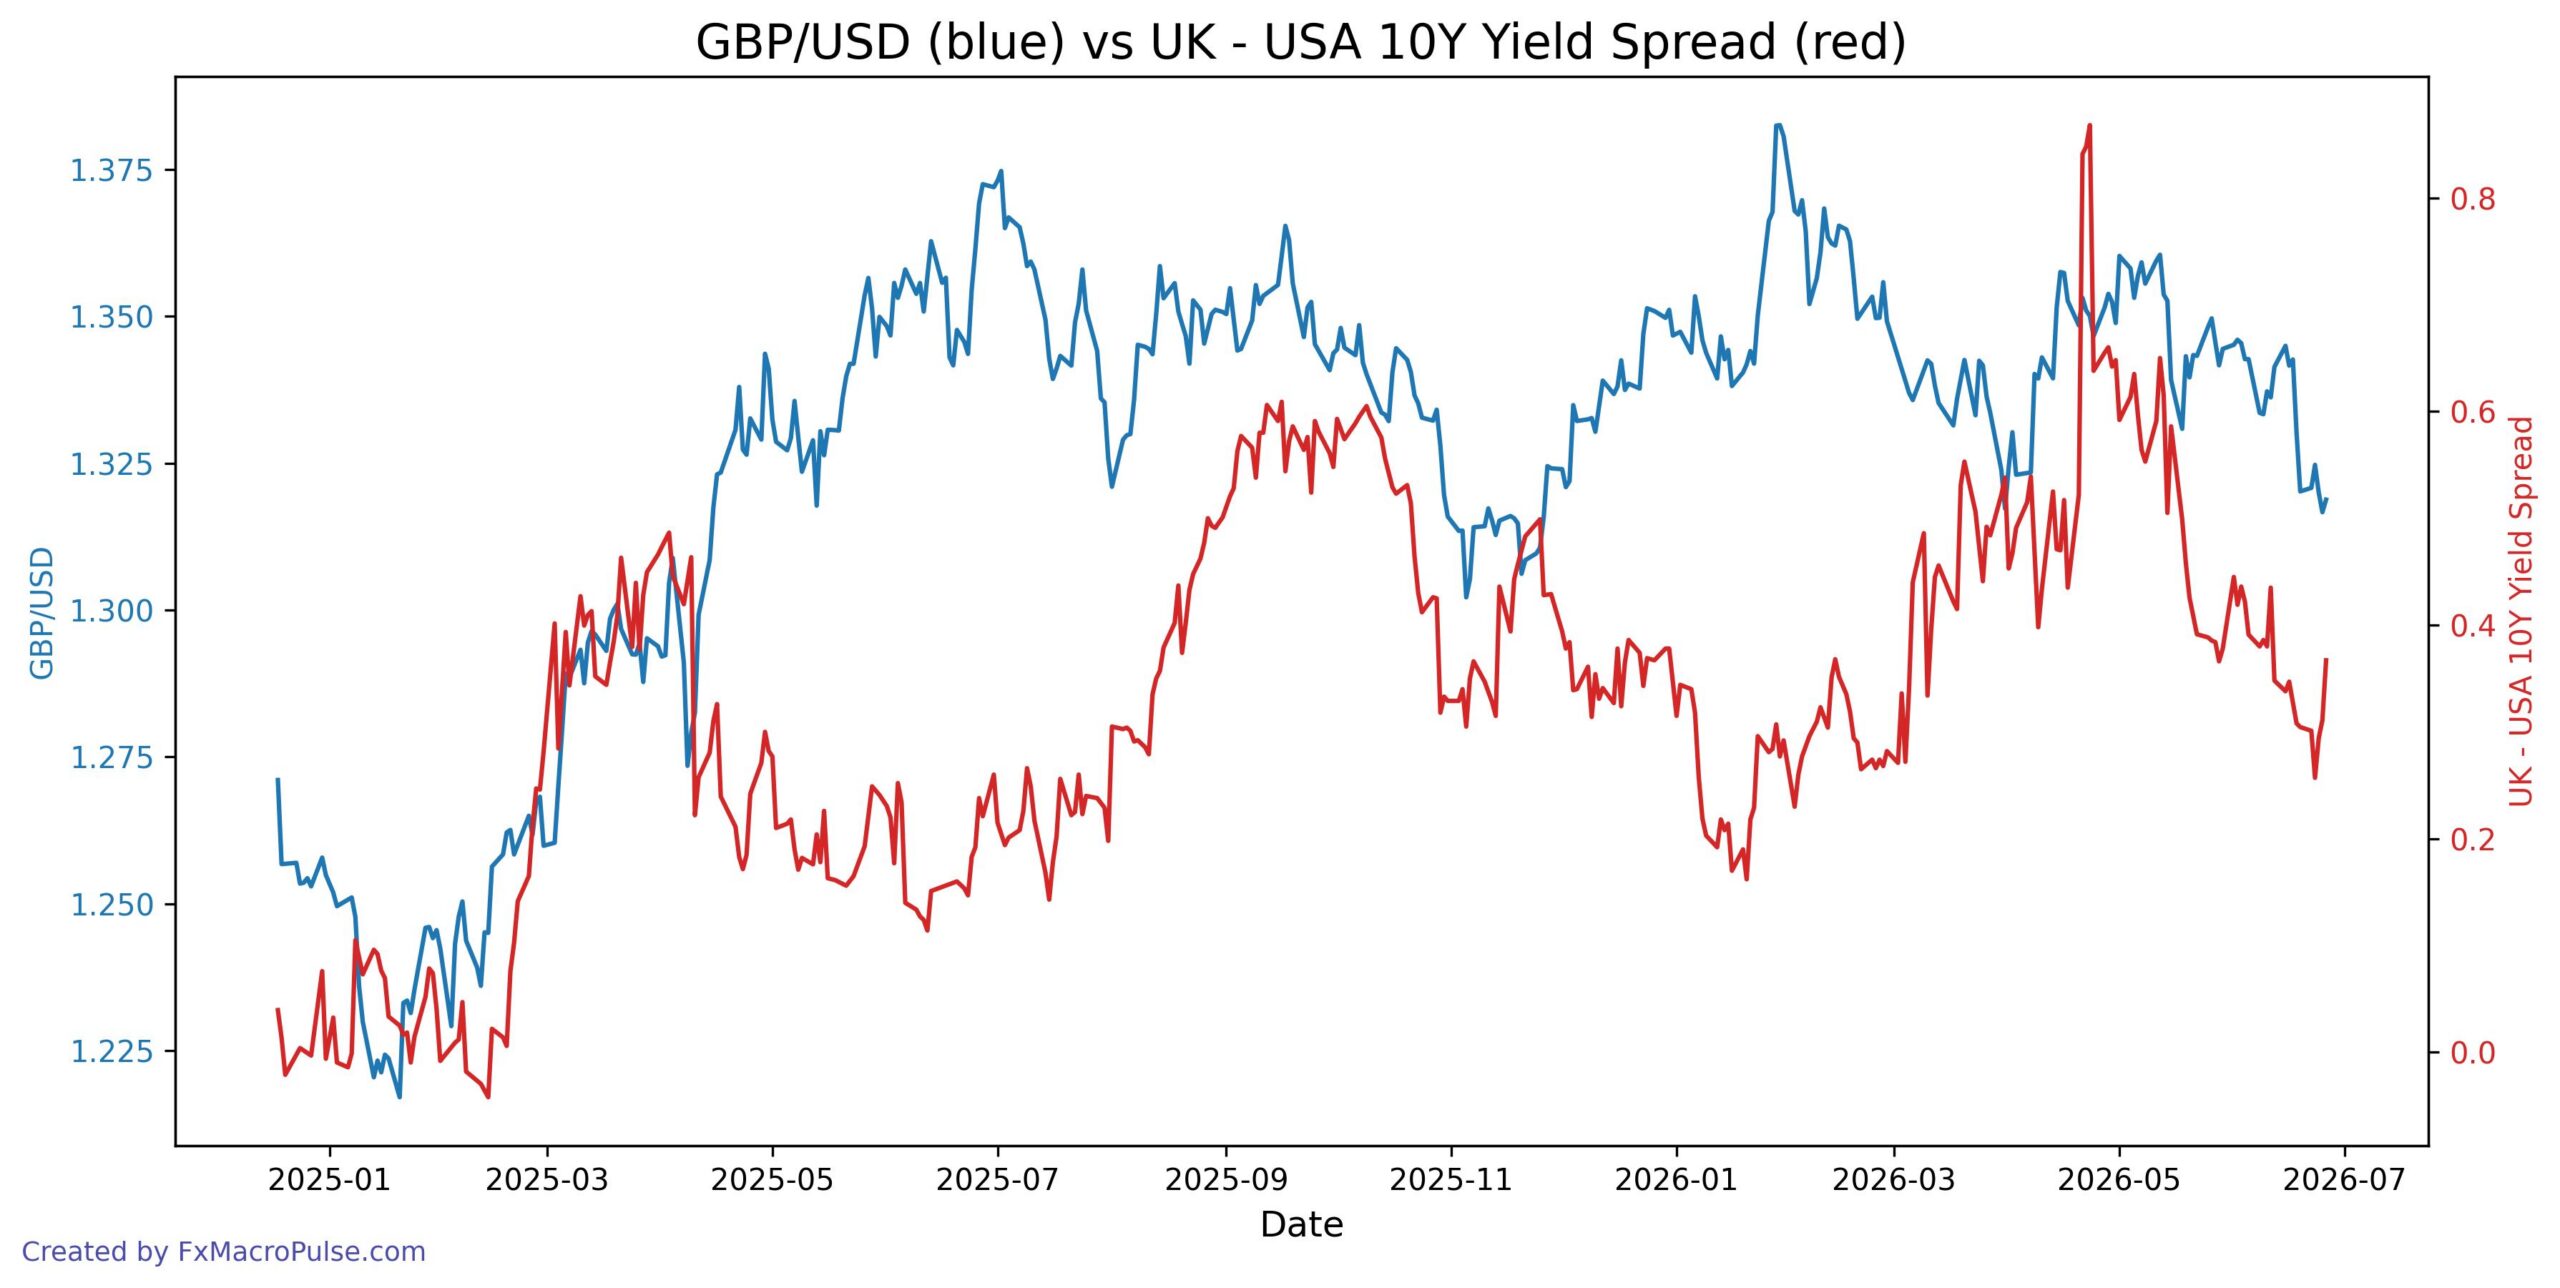
Recent daily price action shows GBP/USD breaking below the 1.32 support zone, with the pair settling around 1.317 in late June 2026. This marks a clear shift from the sideways range of 1.33–1.36 seen through most of May and early June. The move lower coincides with a notable drop in the 10-year yield spread (UK minus USA), which fell from around 0.55 in late May to about 0.31 by June 25. However, the historical correlation between GBP/USD and this spread is only 0.27 – a weak positive link. This means the yield spread alone doesn’t drive the pair.
Looking back, we see periods where the spread rose sharply (e.g., April 2026 spike to 0.84) while GBP/USD actually dropped from 1.36 to 1.33 – a clear divergence. More recently, both the spread and the pair declined, so they converged. But over the entire dataset, the pair shows stronger sensitivity to risk sentiment, UK and US monetary policy expectations, and broader dollar demand.
Technically, the daily timeframe shows a downtrend from the January 2026 high near 1.382. The break below 1.32 opens the door to the next support around 1.305–1.310, a level tested in late 2025. On the weekly chart, the pair printed a bearish engulfing candle in the week ending June 26, adding weight to the bearish bias.
On the macro side, upcoming events could shake things up. The US ISM Manufacturing PMI (July 1) and the NFP report (July 2) are high-impact. Markets expect a slight dip in ISM to 53.7 and a softer NFP at 114K vs 172K prior. If data disappoints, the dollar could weaken and give GBP/USD a bounce. Additionally, both the Fed Chair and BOE Governor speak on July 1 – traders will watch for any rate-cut hints. The BOE has been more cautious, which supports GBP relative to USD when risk appetite is stable.
Important divergence to note: Even with a weak correlation, the yield spread narrowing (UK yields falling faster than US yields) typically points to a weaker pound. Yet the recent price drop aligns with this narrowing – suggesting the spread is currently a supportive factor for the bearish move, not a contradictory one. But don’t rely solely on it; watch risk flows and event risk.
In short, GBP/USD looks vulnerable below 1.32, but the weak correlation with yield spreads tells you other drivers matter more. Focus on US labor data and central bank tone this week. A rally back above 1.33 would negate the breakdown, while a close below 1.31 could accelerate selling. Stay nimble.
COT Analysis
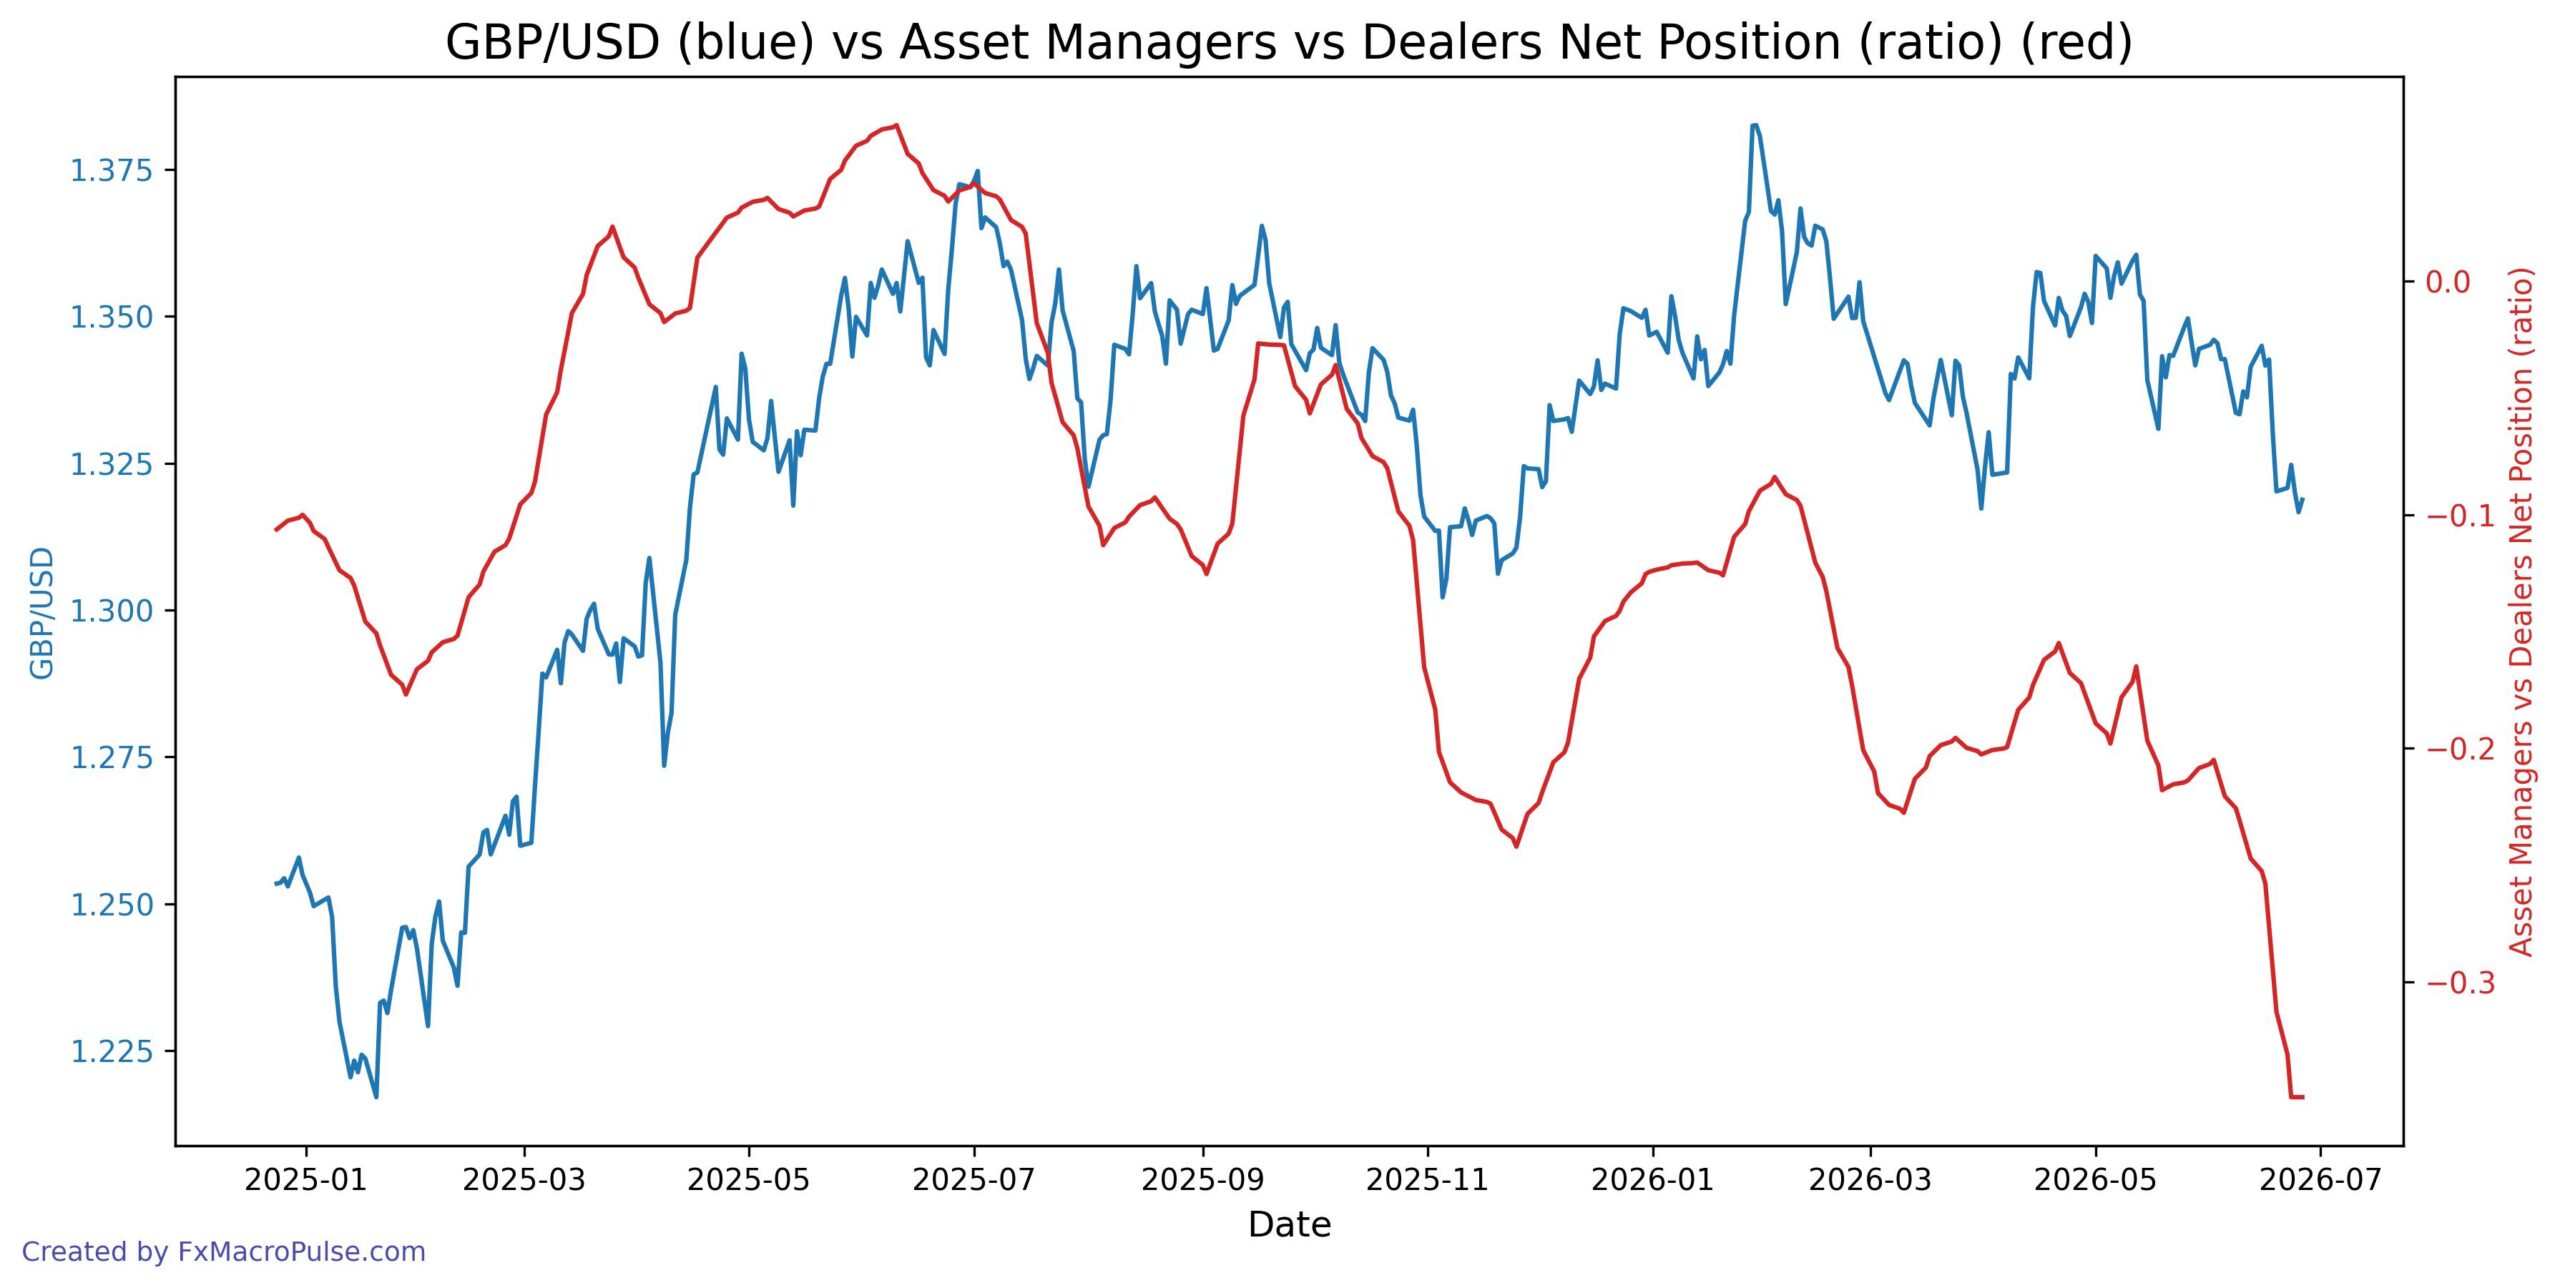
GBP/USD price on the daily timeframe has declined from 1.345 in early June 2026 to around 1.319 by late June, while the Asset Managers vs Dealers spread moved deeper into negative territory (from -0.21 to -0.35). This simultaneous drop in price and spread indicates bearish convergence, meaning commercial dealers are increasingly net long against asset managers, reinforcing the downside momentum. The earlier period from April to May 2026 showed a brief divergence where price rose while spread fell, but the current alignment suggests persistent selling pressure. For daily and weekly traders, the COT data now confirms the bearish trend, with no sign of reversal in positioning.
GBP/USD price and the Large vs Commercial Net Position ratio show a clear convergence since early 2026, as both moved lower together after a period of divergence in late 2025. The ratio turned deeply negative from May 2026 onward, aligning with the recent price decline from the 1.36 area to near 1.32. Currently, price sits around 1.3188 with the COT spread at -0.259, indicating that large speculators maintain a strong net short bias while commercial traders are net long—a bearish sentiment consistent with the ongoing downtrend. This alignment suggests persistent selling pressure on the daily and weekly timeframes.
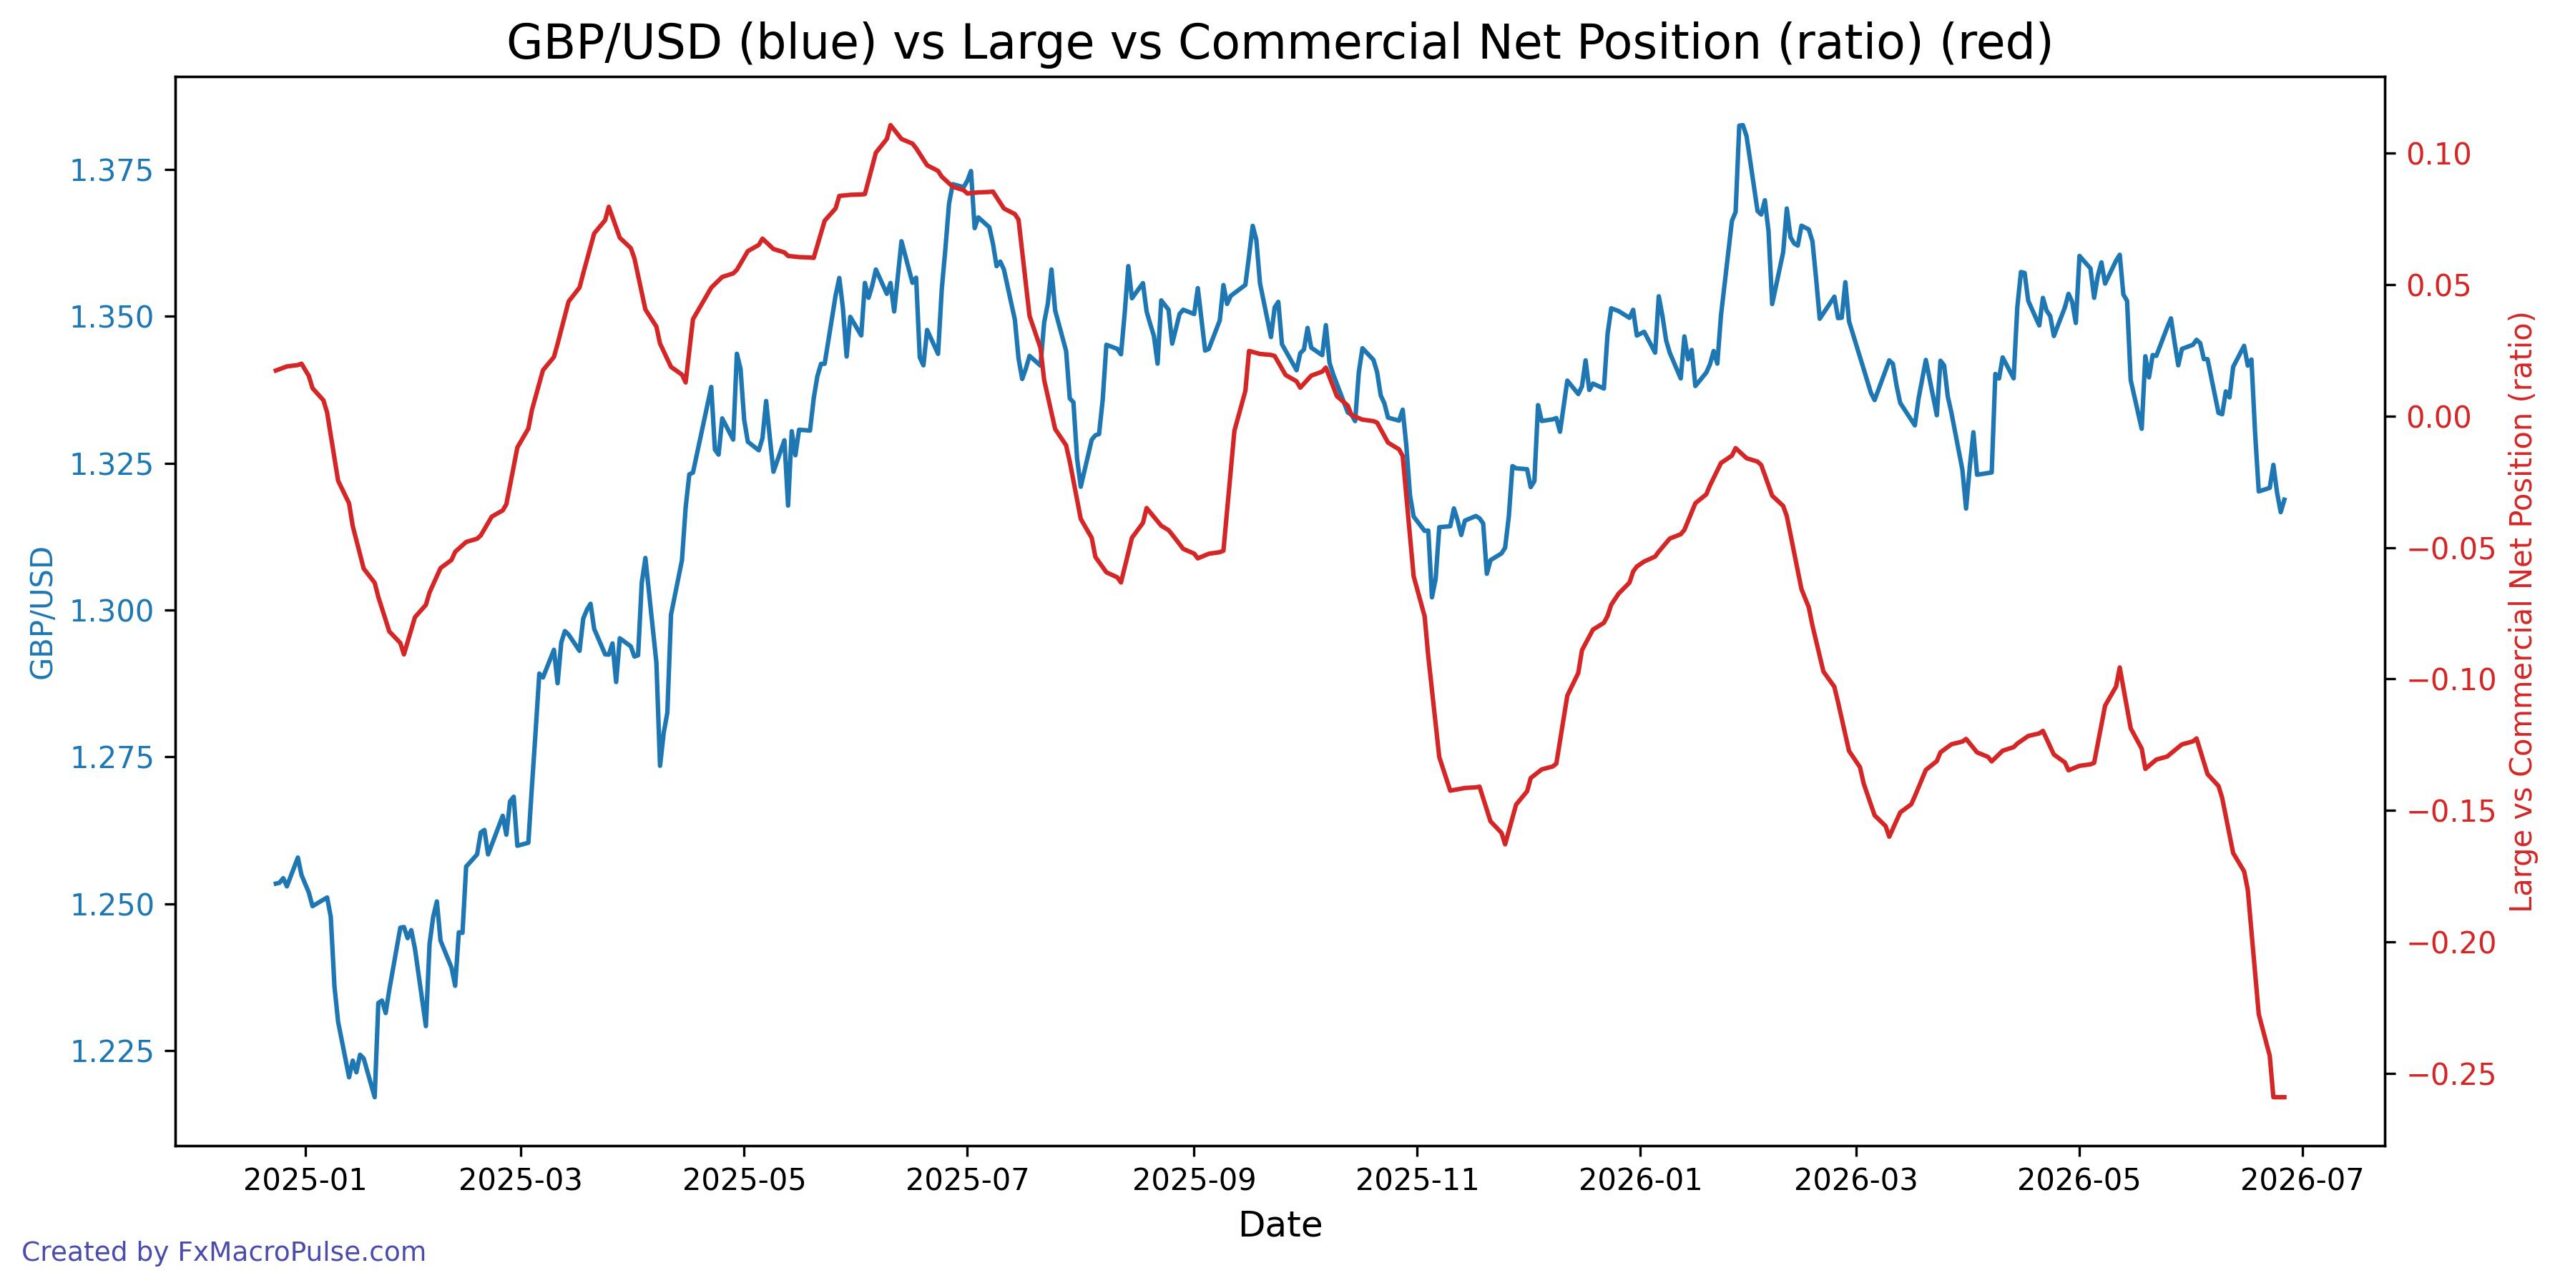
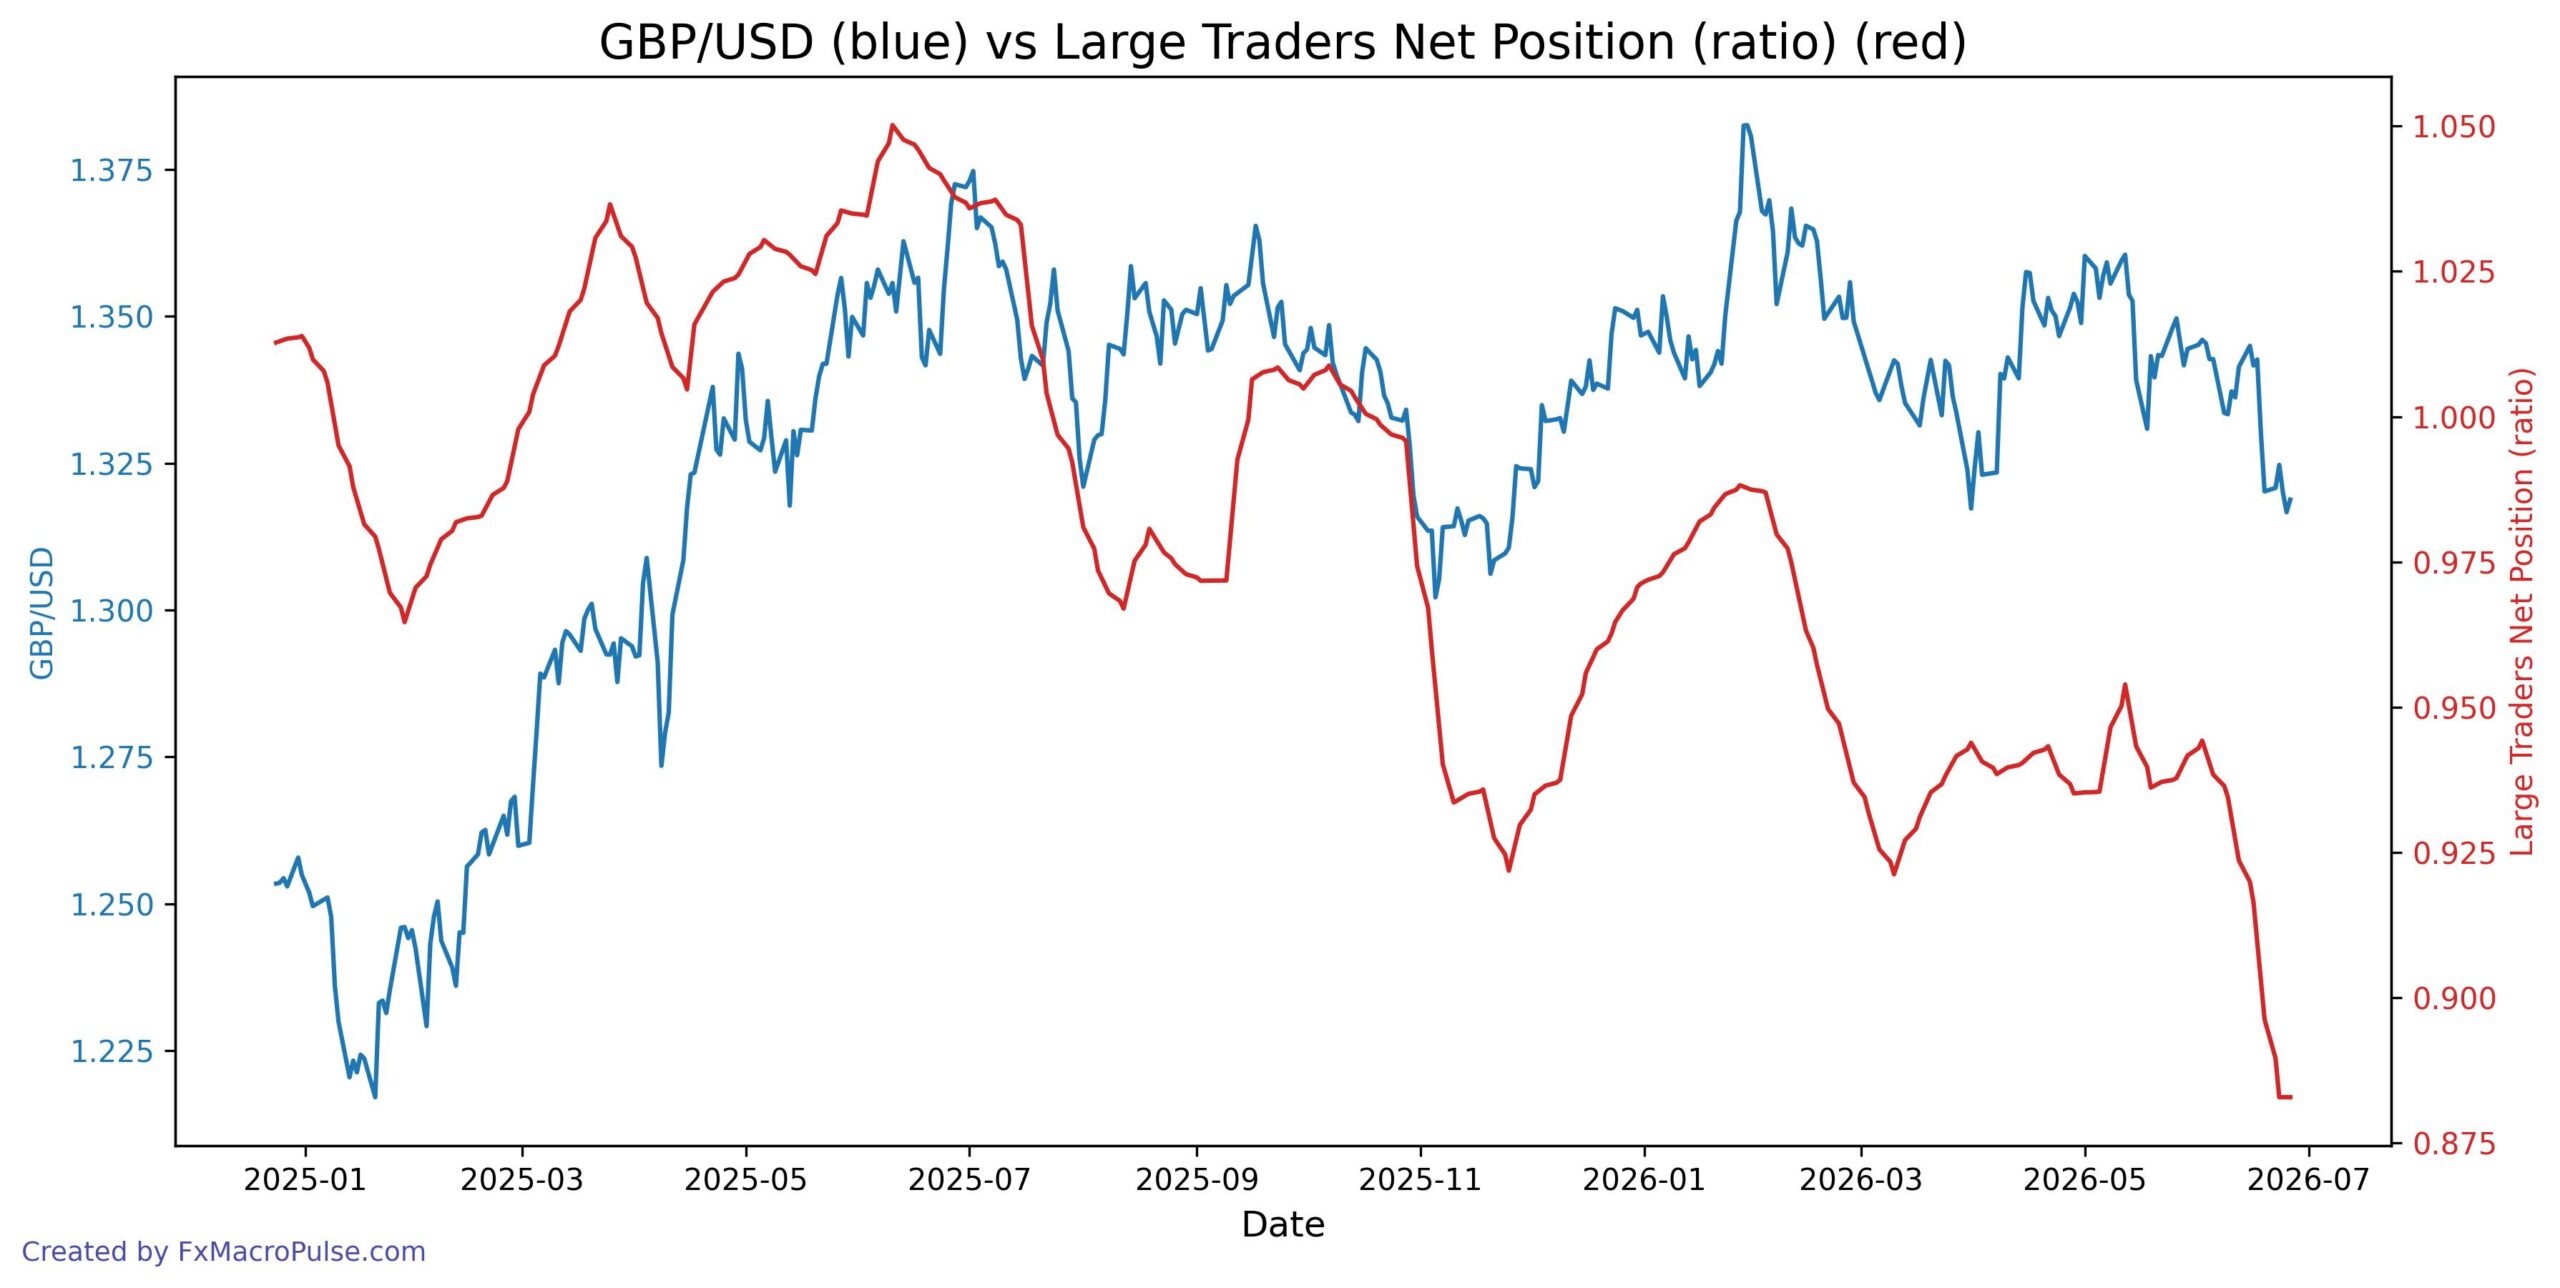
From late May 2026, GBP/USD price and the Large Traders Net Position ratio both declined sharply, showing a bearish convergence. However, over the last two weeks of June, price continued to make new lows near 1.317 while the ratio flattened around 0.8829, creating a bullish divergence. This divergence suggests that the selling pressure may be exhausting, and the downtrend could be losing momentum.