Macro Analysis
“GBP/USD and Yield Spread: Converging Trends Signal a Pause?”
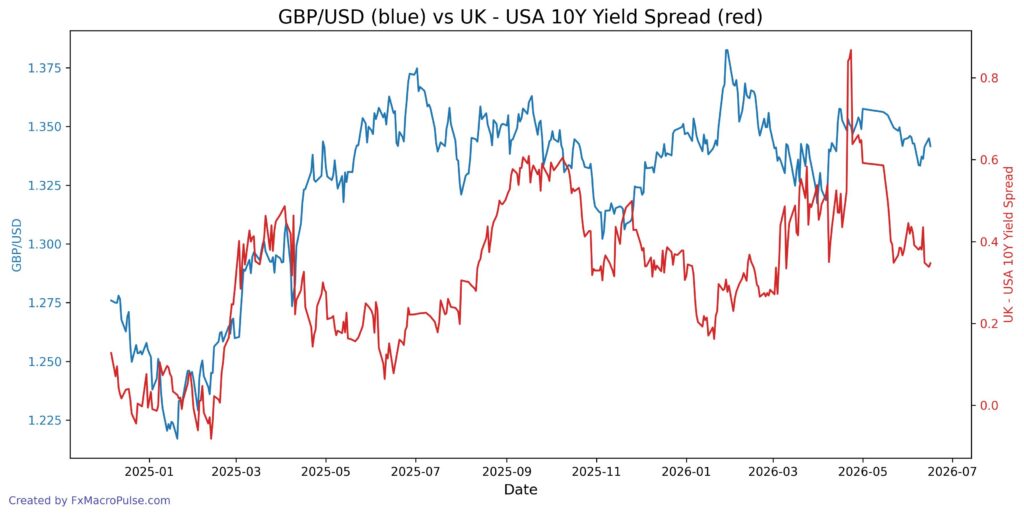
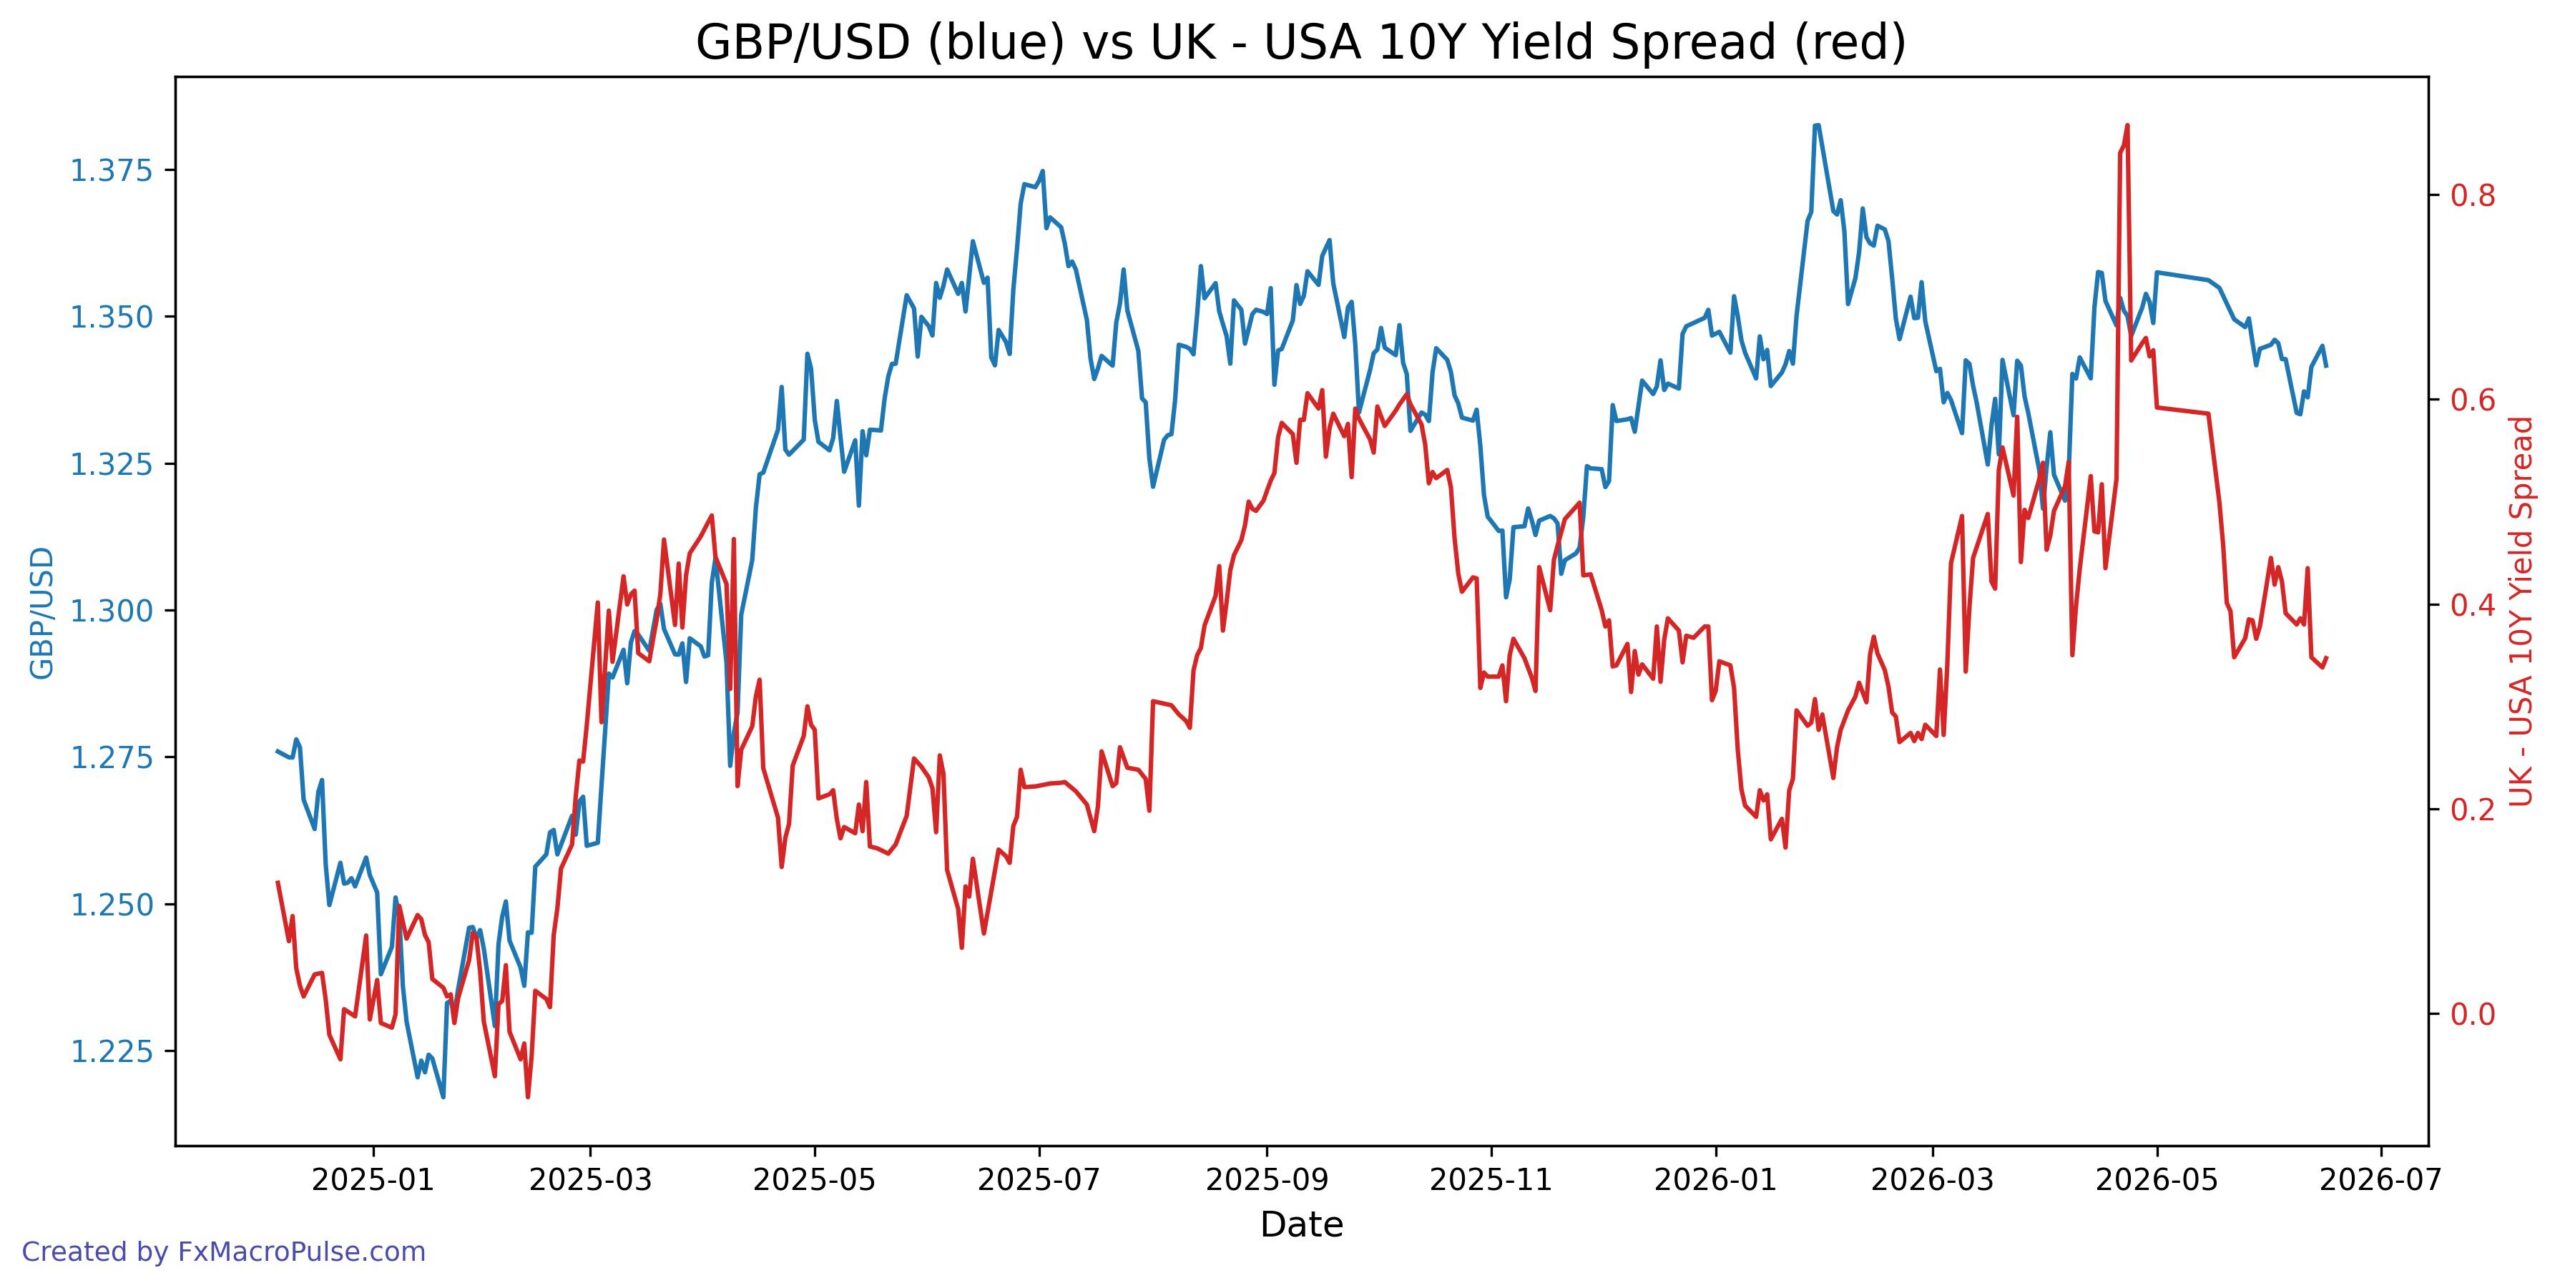
On the daily timeframe, GBPUSD has been edging lower since late May, sliding from the 1.3550 area to around 1.3416 by mid-June. The price remains well within a broader range between 1.32 and 1.36, lacking clear directional momentum. Over the same period, the UK-US 10-year yield spread has also declined – from near 0.45% in late May to around 0.35% in mid-June. Given the historically weak positive correlation of 0.28, this recent simultaneous move lower represents a convergence of trends, but it does not imply a strong causal link.
The yield spread has been trending down since its mid-April spike above 0.84%, and GBPUSD’s sluggish descent aligns with that broader narrowing. However, the pair’s reaction to the spread remains muted – each drop in yields has not triggered a proportional drop in the pound. This suggests other factors, such as expectations around Bank of England policy and US economic data, are currently more influential.
Key macro events this week – the BoE holding rates at 3.75% with a unchanged vote split, mixed UK employment data (Claimant Count slightly better, Average Earnings slightly lower), and a US retail sales report from the UK – all offer near-term catalysts. The market also faces a US bank holiday on June 19, which may thin liquidity. For now, GBPUSD continues to track the yield spread loosely lower, but without a clear breakout, it remains in wait-and-see mode. The weekly timeframe shows a series of lower highs since April, and if the yield spread continues to compress, it may keep the pair anchored near the 1.33–1.34 support zone.
COT Analysis
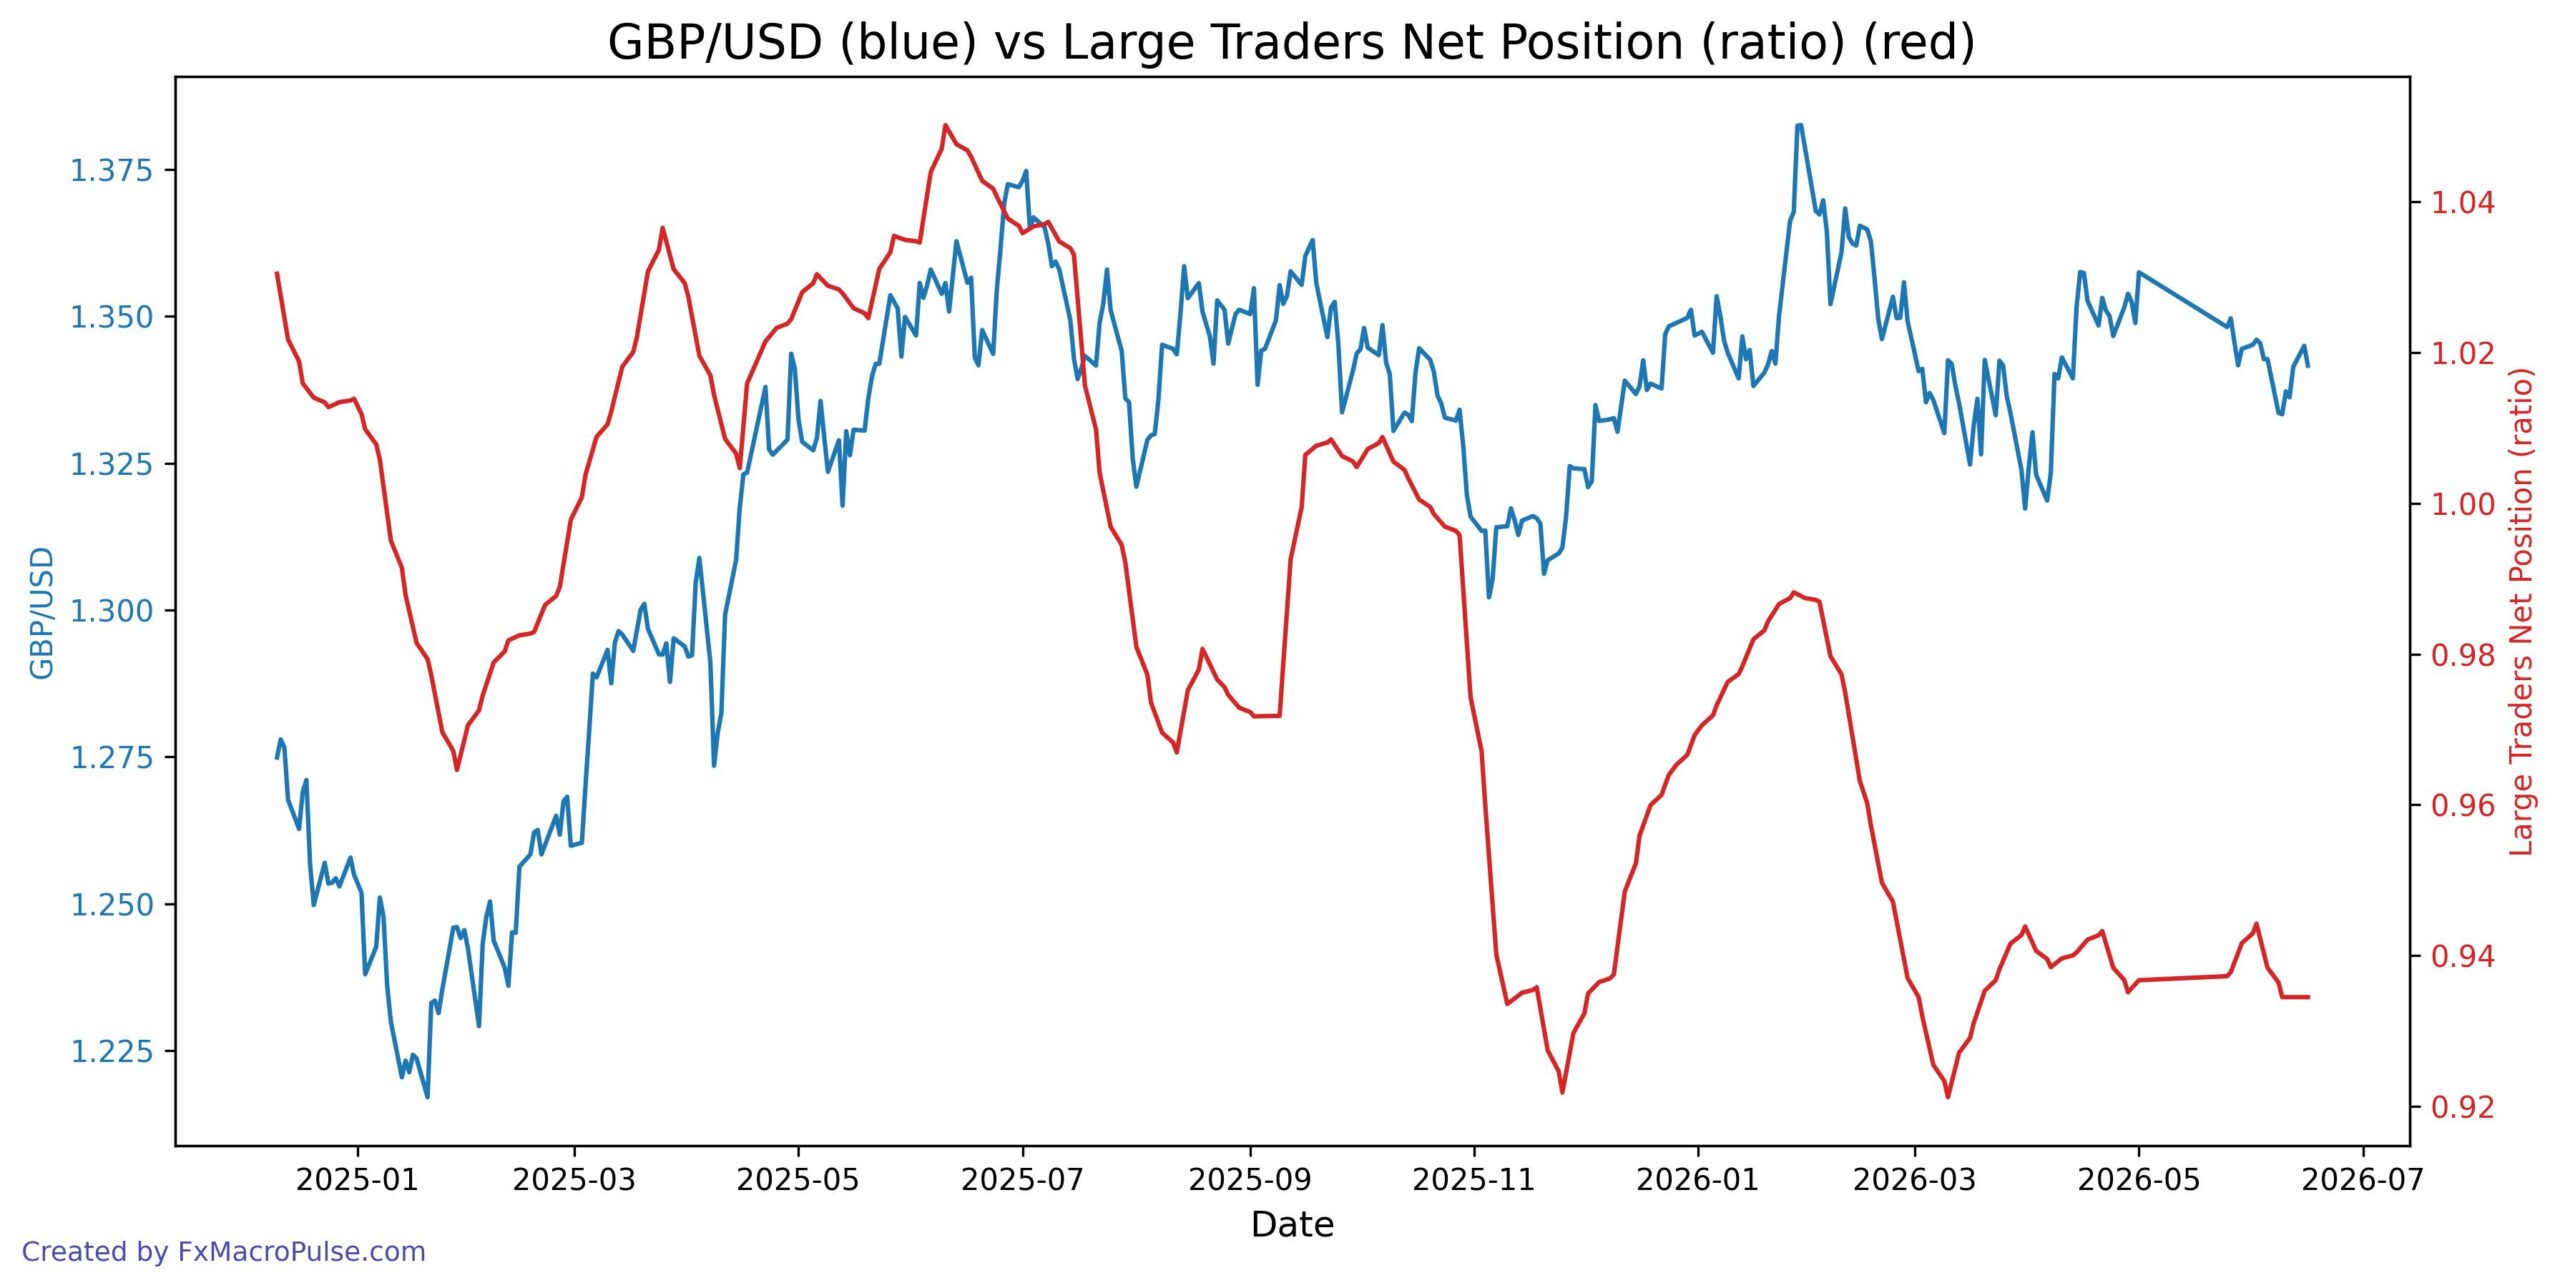
Recent daily price action for GBP/USD shows a sideways consolidation between 1.33 and 1.38, while the COT large trader net position ratio continues to decline from 0.99 to 0.93, indicating a clear bearish divergence. This means large speculators are reducing their long exposure even as the pair holds near key support, suggesting underlying weakness. Traders should monitor whether price breaks lower to confirm the divergence or if a sudden reversal in sentiment shifts the ratio higher.
GBP/USD has consolidated around the 1.34 level over the past few weeks, but the COT sentiment indicator shows a persistent and deepening negative divergence. The Large vs Commercial net position ratio has fallen from roughly -0.12 in late April to -0.145 by mid-June, reflecting growing bearish positioning by speculators. Despite this, price remains relatively steady, creating a bearish divergence that cautions against chasing the rally. This mismatch between weakening sentiment and stable price often precedes a downward correction if the macro backdrop also turns cautious.
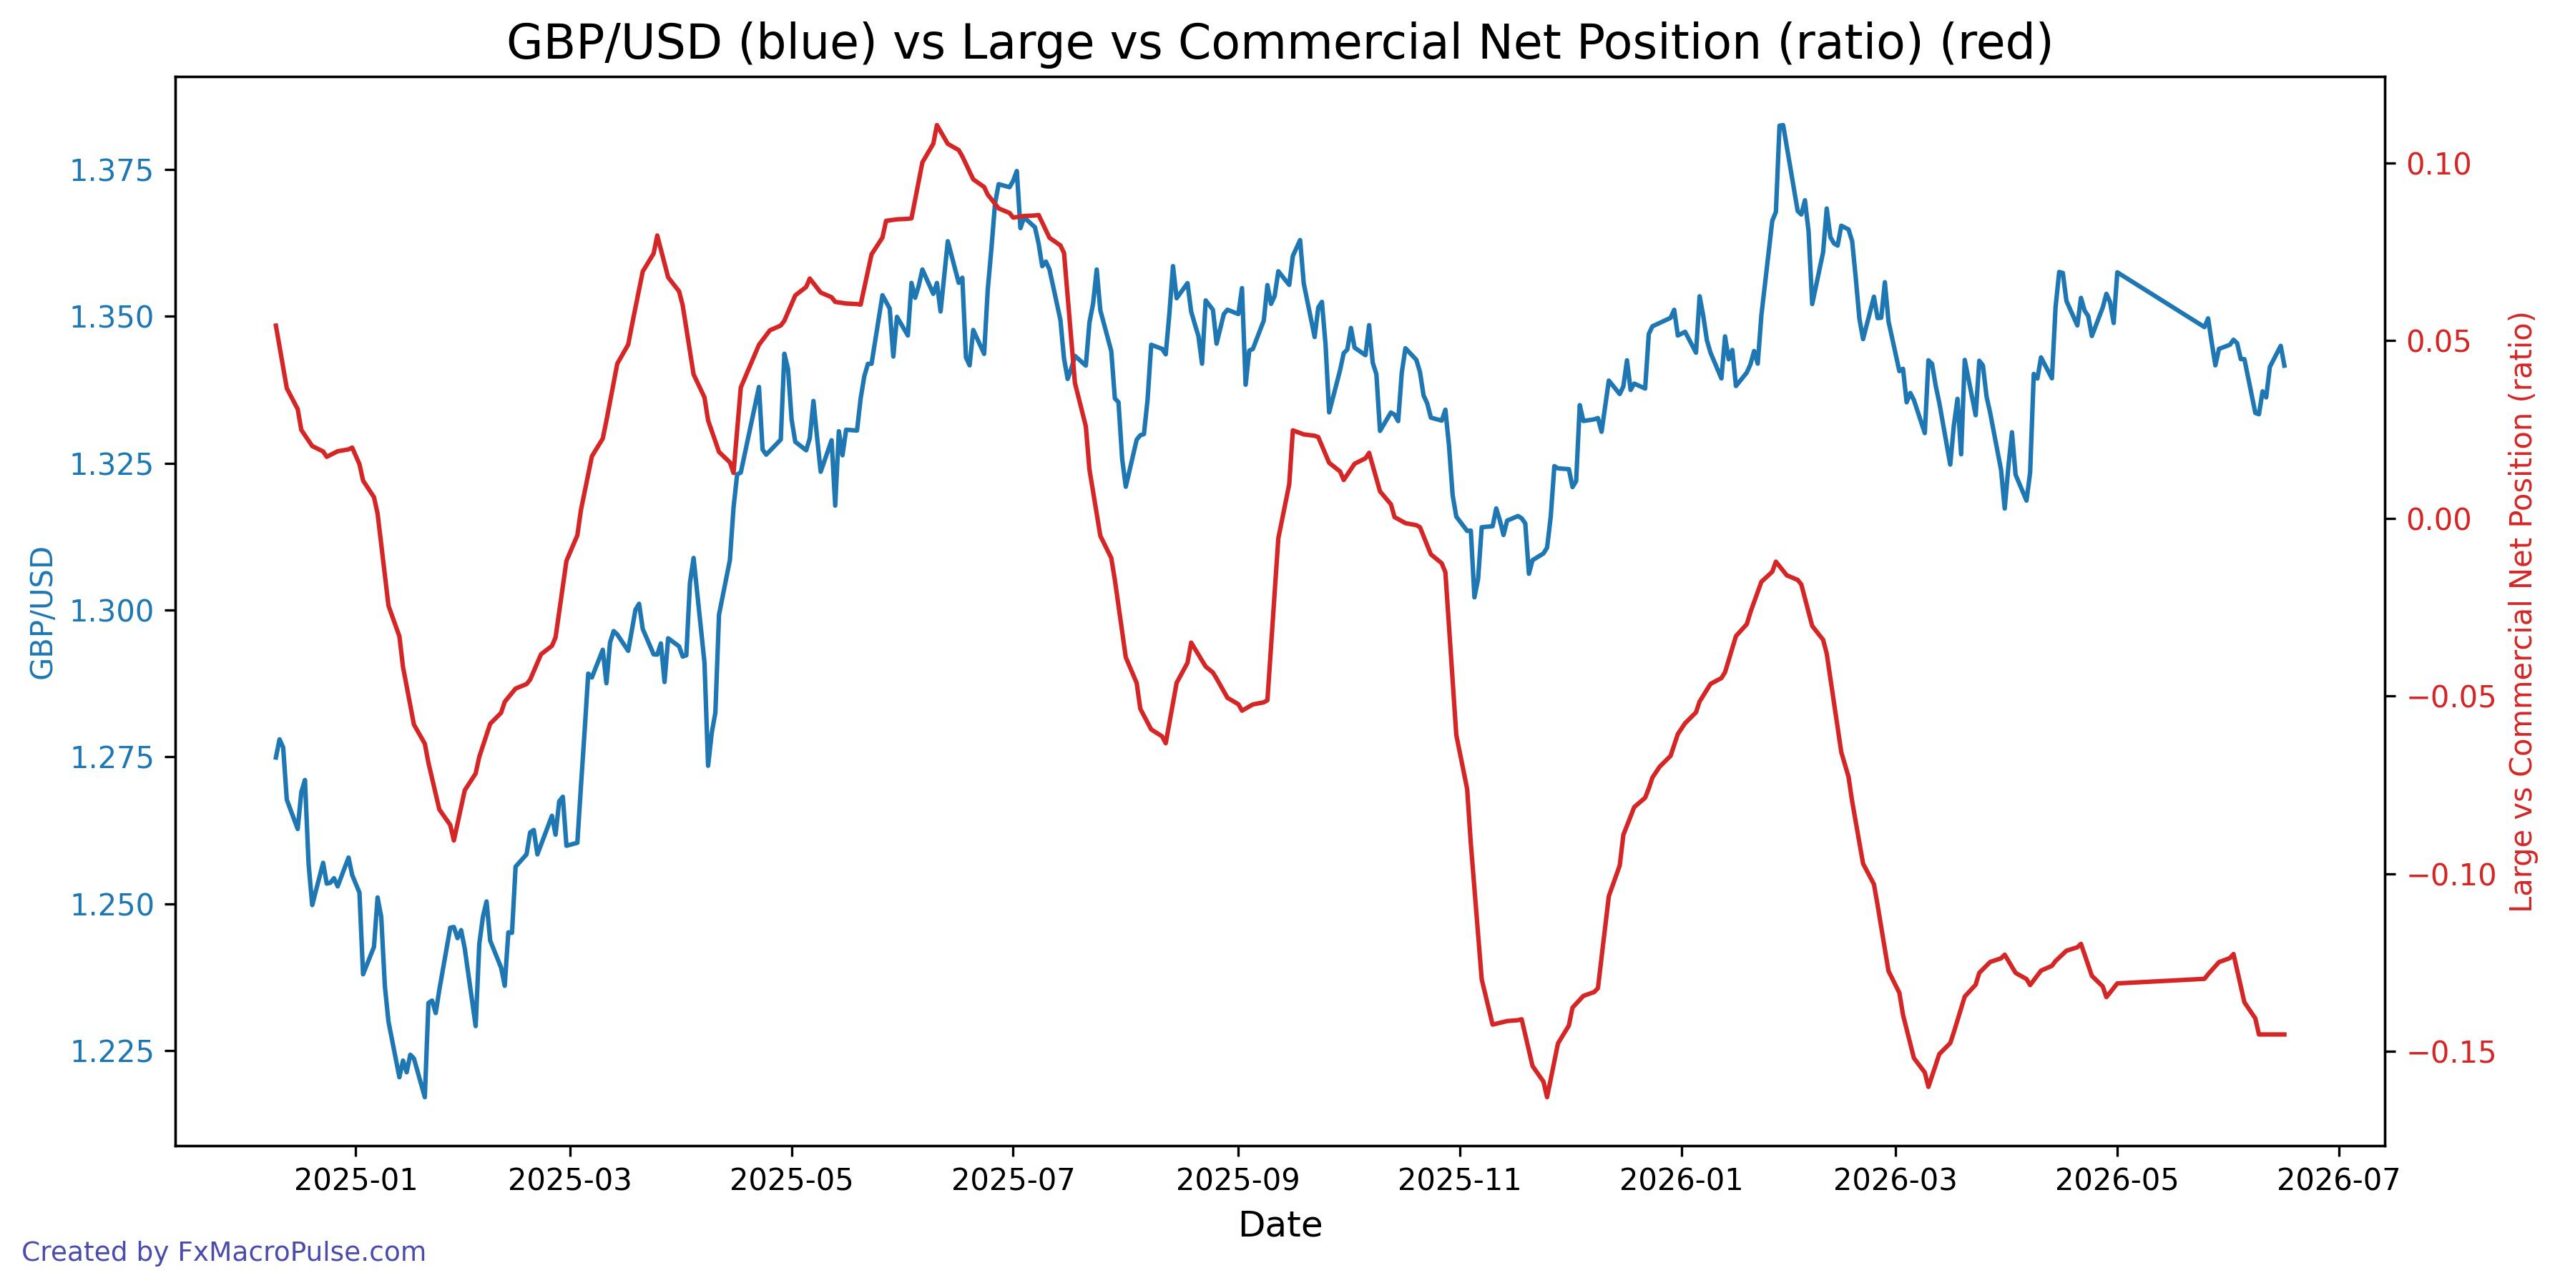
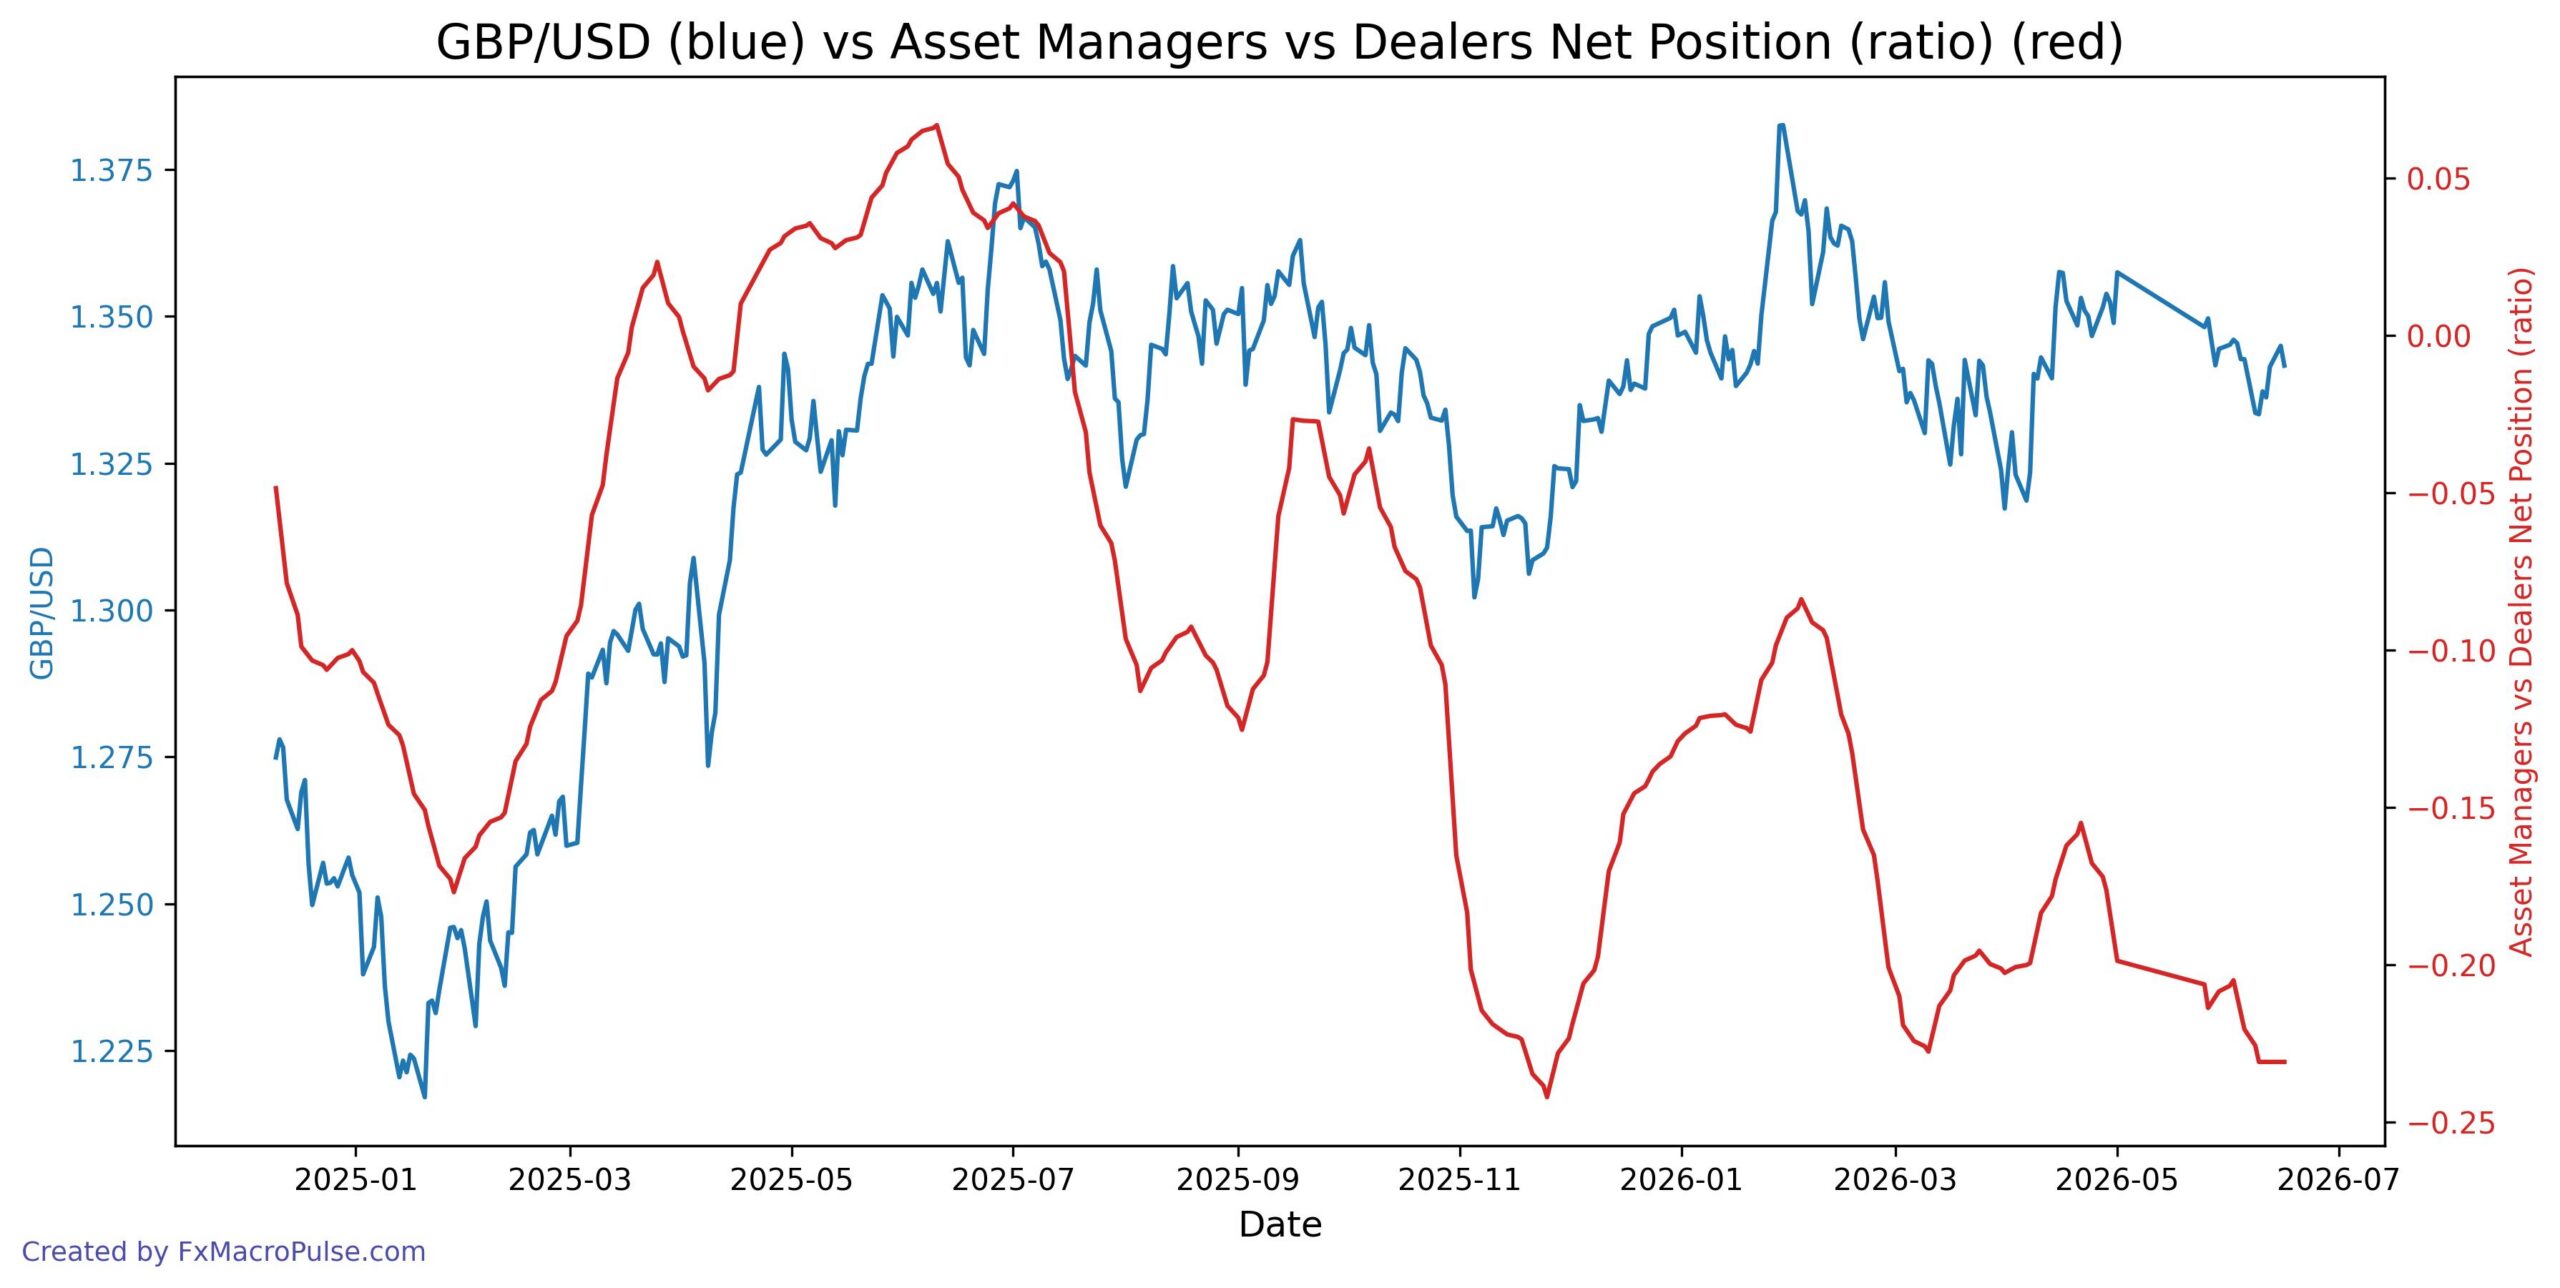
GBP/USD shows a clear bearish divergence on the daily timeframe: price has consolidated near 1.33–1.34 since early 2026, but the Asset Manager vs Dealer spread has become increasingly negative, reaching -0.23 in June 2026. This widening negative spread indicates that commercial hedgers (dealers) are net long against asset managers’ net short positioning, a setup that often precedes price weakness if the trend reverses. The lack of price follow-through despite extreme sentiment suggests traders should watch for a breakdown below 1.32, as the divergence resolves lower. However, the COT data alone does not guarantee a move—price direction depends on broader macro catalysts like rate differentials and risk appetite.