The daily chart for USD/JPY shows a pair that is climbing even as its traditional fundamental driver weakens.
Looking at the price action, USD/JPY established a significant low near 140.80 in mid-September 2024. Since then, it has staged a steady recovery, crafting a pattern of higher lows and higher highs. The move accelerated in late 2026, with the pair breaking back above the 158.00 level. This price structure suggests persistent buying pressure on the daily and weekly timeframes.
However, this trend directly contradicts the movement in the key 10-year yield spread (USA – Japan). Over this same period, the yield spread has been in a clear downtrend, falling from levels above 3.00% to near 2.00%. Historically, a narrowing spread should make the US dollar less attractive versus the yen, yet the opposite price action is occurring.
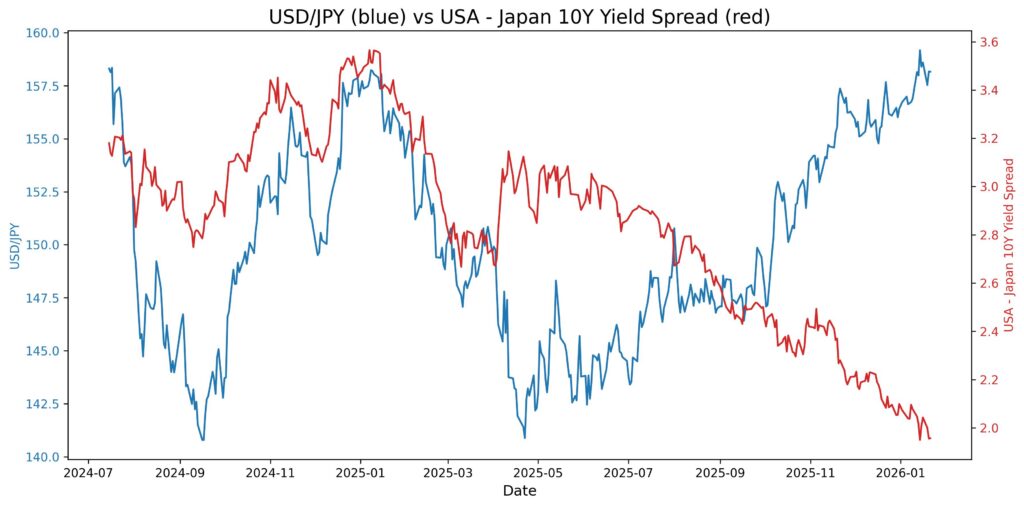
This creates a stark and growing divergence. The historical correlation between the pair and the spread is virtually non-existent at 0.01, and recent action reinforces that this relationship has broken down. For traders, this means macro factors like yield differentials are not currently directing price.
The primary takeaway is that other forces are overwhelming the traditional yield spread dynamic. Market focus has likely shifted to factors like the risk of Japanese FX intervention to support the Yen or evolving expectations for the Bank of Japan’s policy path. Technically, the bullish price structure remains intact, but traders should be aware it is progressing without support from this key fundamental metric. Watch for any shift in BoJ rhetoric or intervention cues as potential catalysts, while monitoring the established higher lows for signs of technical strength.