Macro Analysis
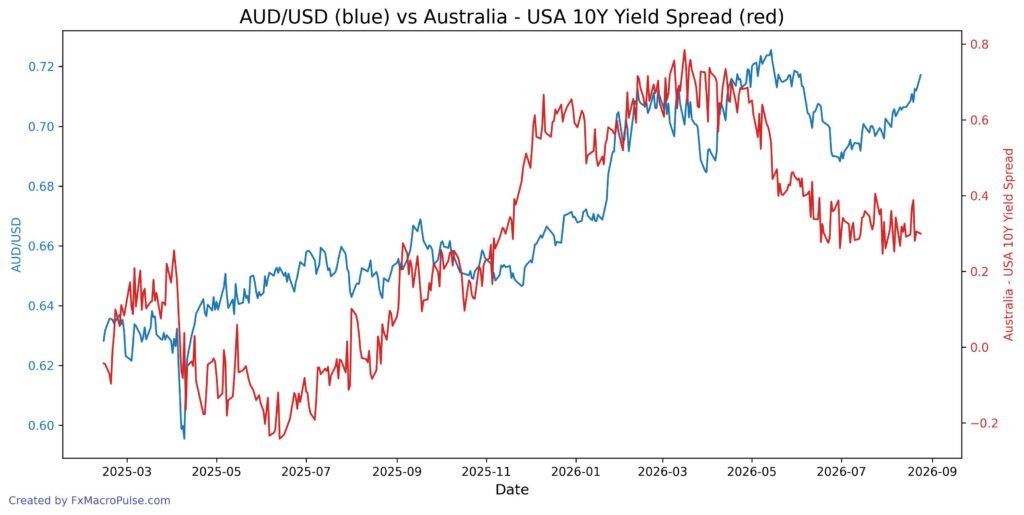
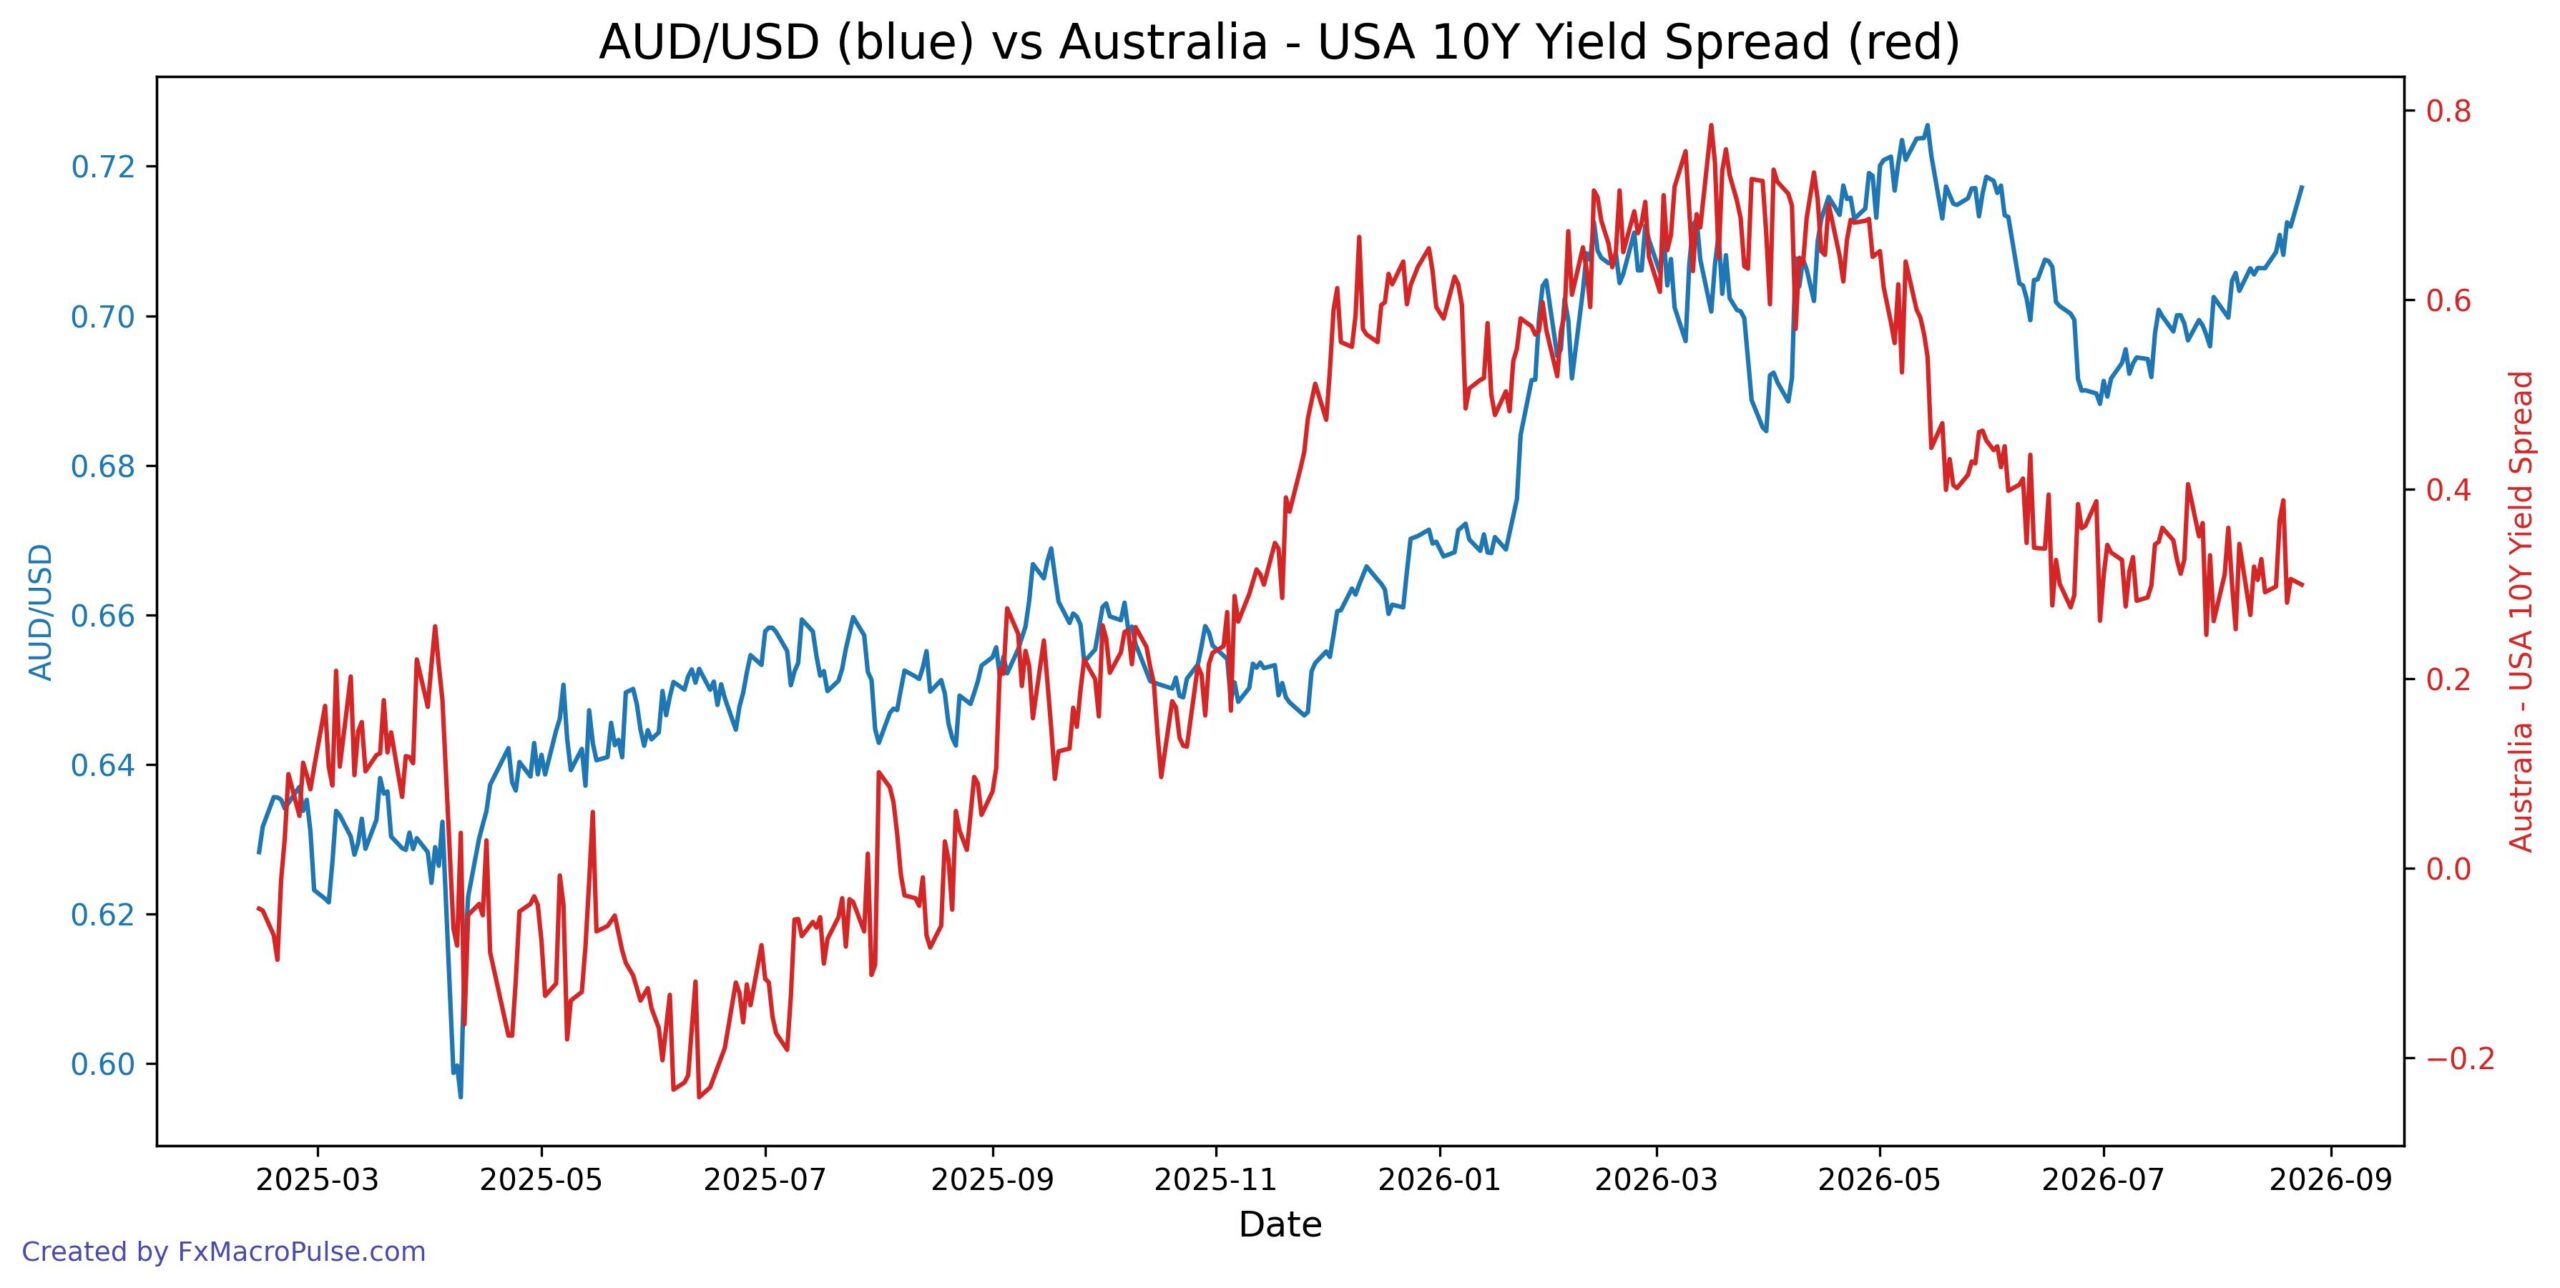
The MacroFlow Index is a proprietary index created to track the pair’s fundamentals, and tracks the following: Australia/US 10Y Gov. Yield Spread, Australia/US Stocks Index Ratio, Gold Futures, Iron Ore 62% Fe CFR China Futures. Its historical correlation with AUD/USD is 0.81, so when the two move apart, traders pay attention.
On the daily timeframe, AUD/USD has shifted from weakness to strength. After bottoming near 0.688 in late June, the pair made higher lows and higher highs. It climbed back above 0.70 and now trades near 0.71714. That puts price just below the 0.7200-0.7250 resistance zone from May. On the weekly timeframe, this looks like a recovery within a larger range, not a confirmed breakout yet.
The relationship with the MacroFlow Index has changed recently. In early July, both the pair and the index moved lower together. Since mid-July, they have diverged. The MacroFlow Index drifted from about 99.02 in mid-June down to roughly 98.78 in late August, and it has been flat through August. During that same period, AUD/USD rallied from 0.688 to 0.717. That is a clear divergence: price is rising while the fundamental index stays soft. Because the index is positively linked to the yield spread, the Australia/US stock ratio, gold, and iron ore, a flat index suggests those macro inputs are not backing the recent AUD strength.
The next major test comes with Australian CPI on 2026-08-26. Forecasts point to a rebound in quarterly CPI, but annual CPI is expected to slow to 3.3% from 3.8%. A strong inflation print could support AUD and help the MacroFlow Index turn higher. A weak print would leave the rally looking unsupported. On the USD side, Core PCE, GDP, and Fed Chairman Warsh’s speech can move the dollar. If the dollar firms, AUD/USD could face selling near 0.7200-0.7250. Key support sits near 0.7100, with stronger support around 0.7050. Watch whether the MacroFlow Index starts to follow price higher; if it stays flat while AUD/USD breaks above 0.7200, the divergence will become even more noticeable.
COT Analysis
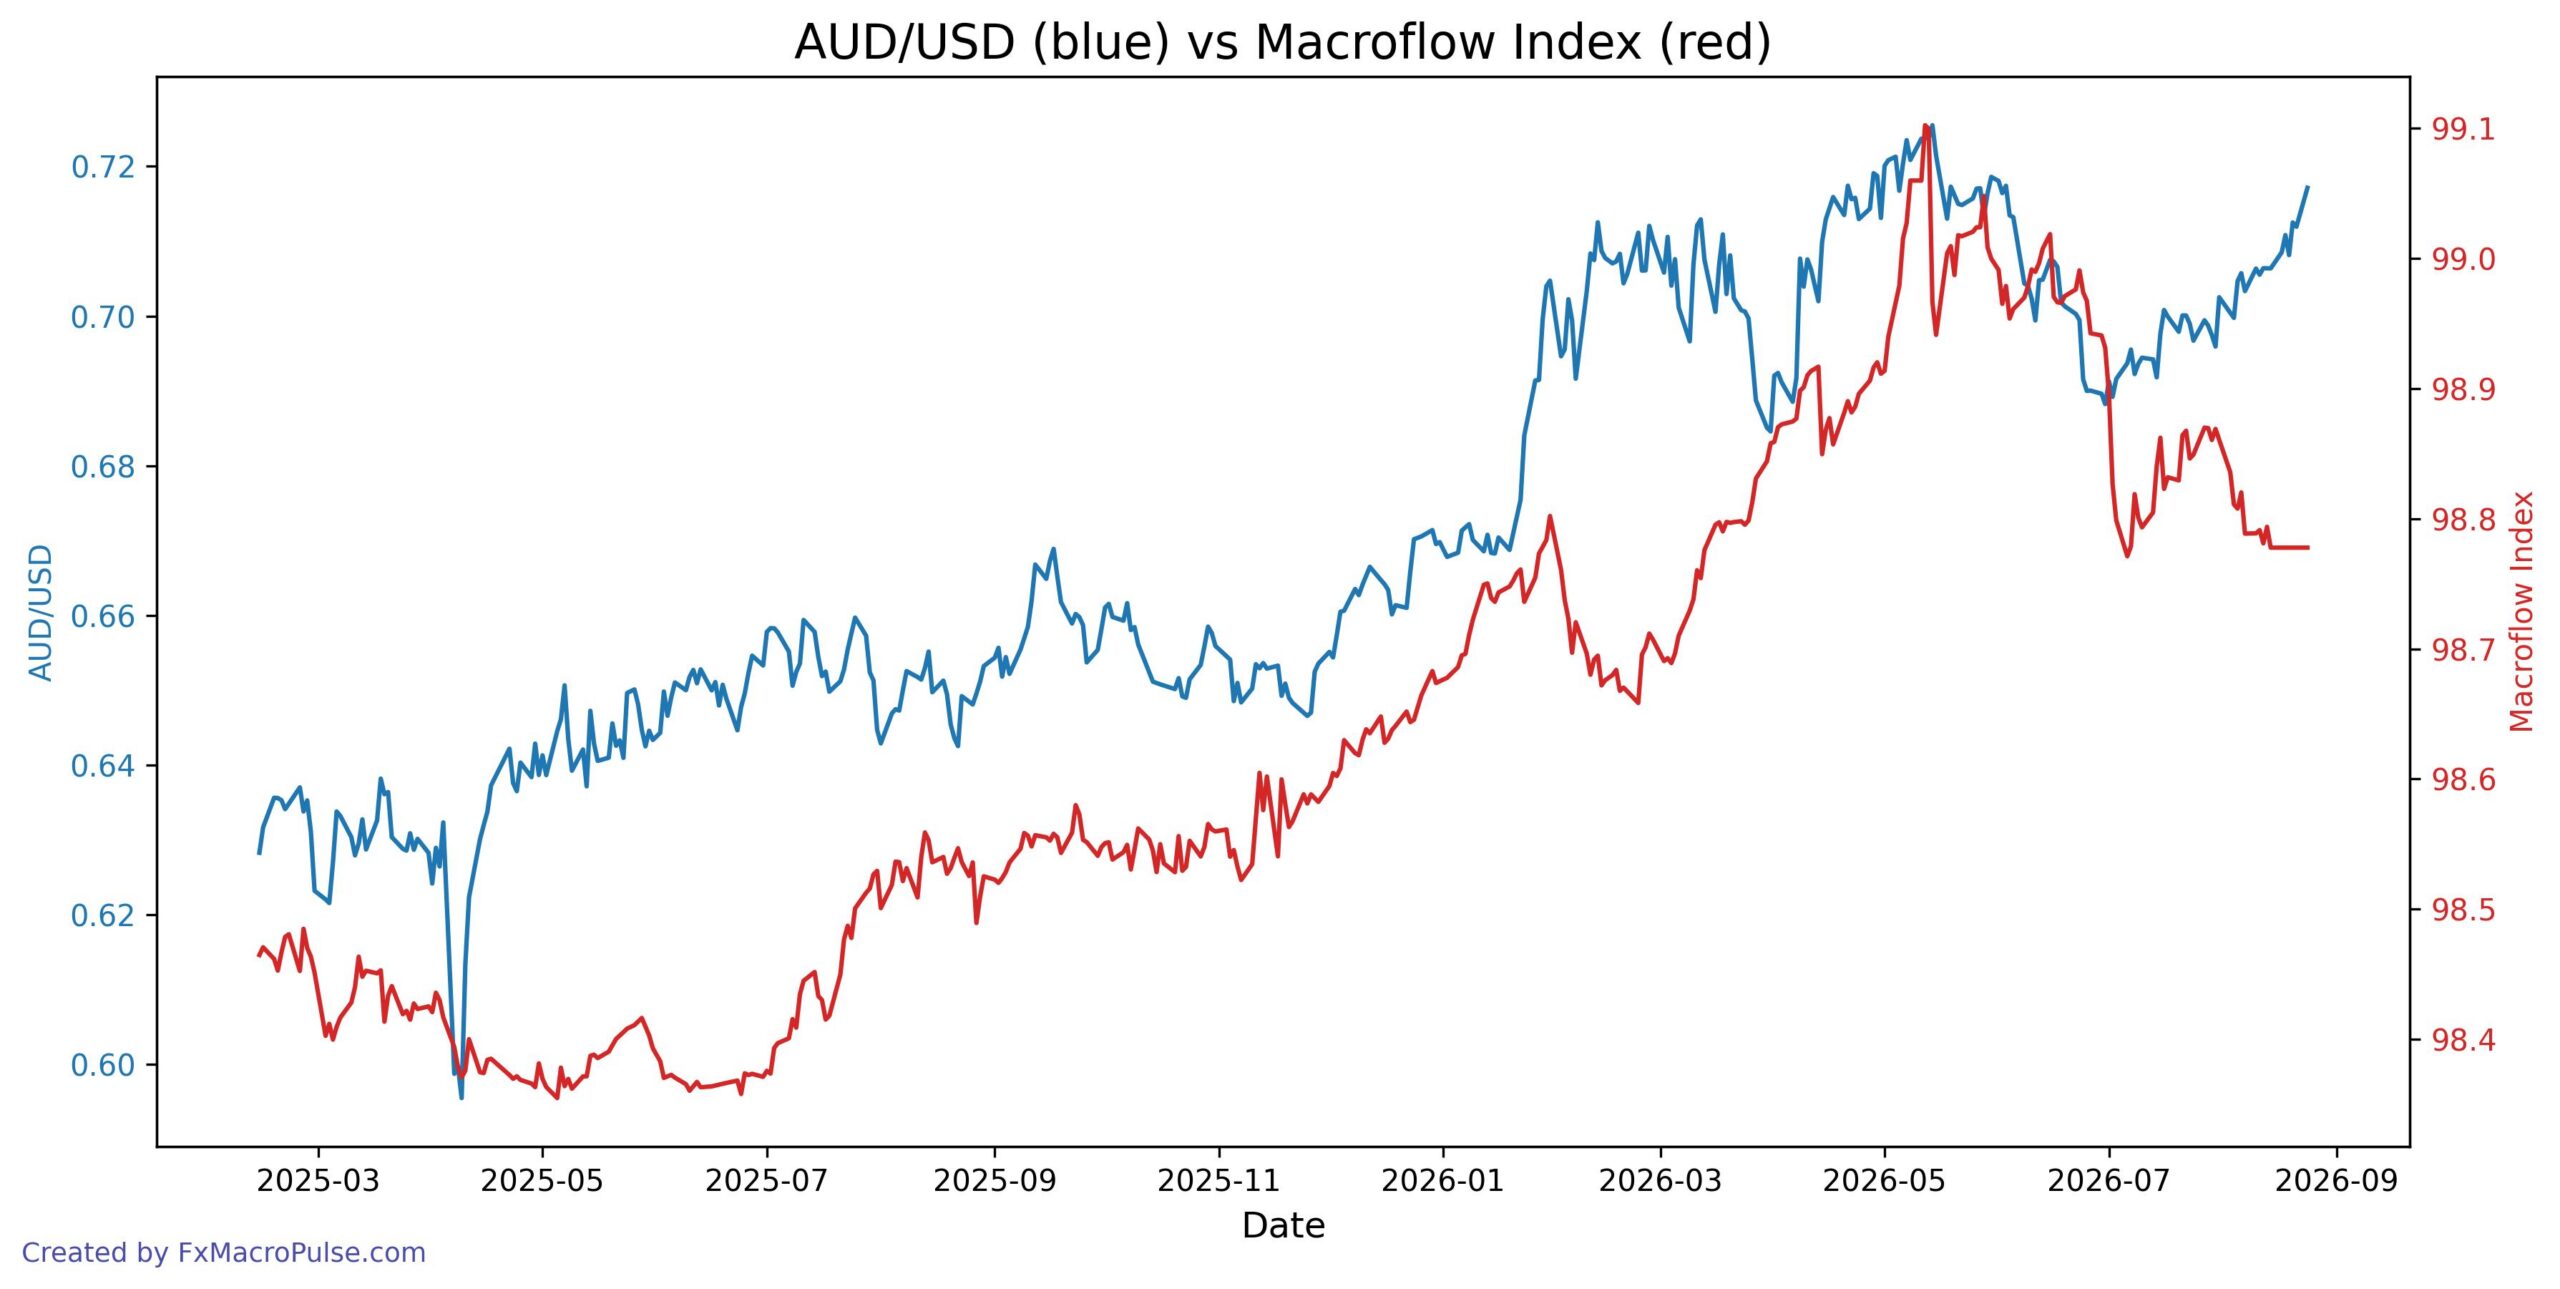
AUD/USD trades near 0.7170 on the daily chart, having climbed sharply from the 0.6880 lows in early July as the greenback weakened broadly. The small-trader net-position ratio, however, has declined from its February peak of 1.029 to 1.021, creating a bearish divergence against the recent price rally. This divergence suggests retail bullish positioning has faded even as price makes higher lows, so traders should watch whether momentum can hold above the 0.7200 area. Firm commodity prices and RBA rate expectations support the pair, but the COT signal warns of thinning participation at high levels.
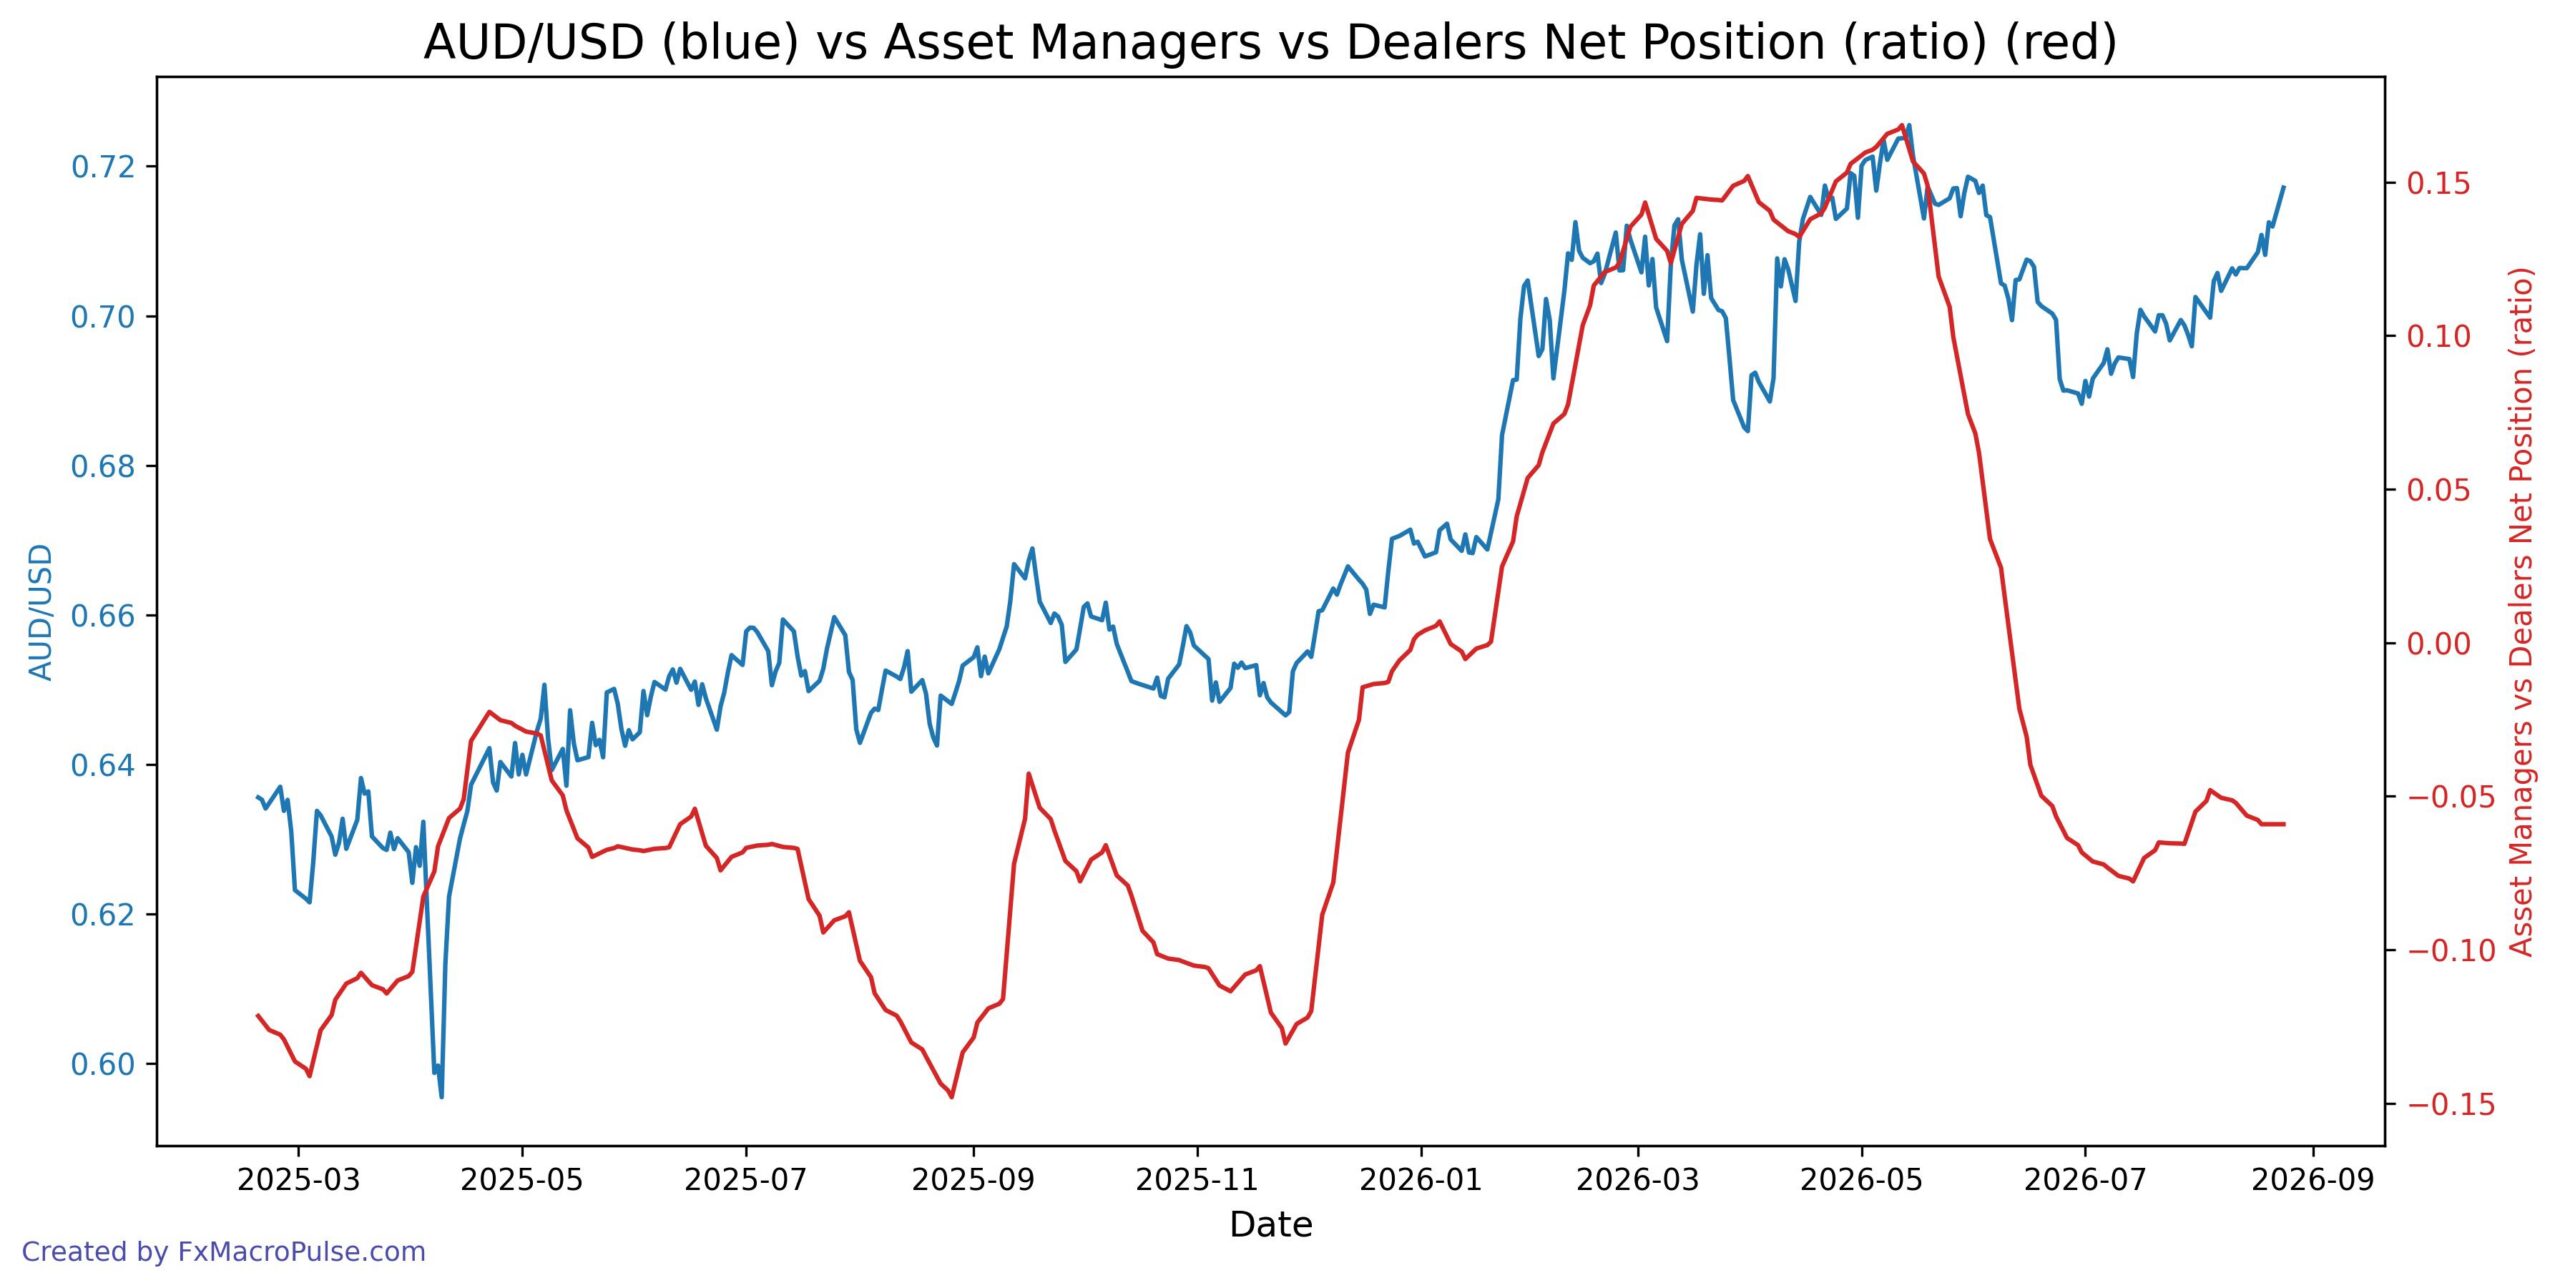
AUD/USD rallied from around 0.700 to 0.717 in late August, breaking higher on the daily chart. However, the COT spread stalled at -0.059 during the same period, after recovering from -0.077 in July. This divergence shows the price uptrend lacks fresh backing from asset manager versus dealer positioning. The rally has weaker confirmation from this money flow indicator, so traders should watch whether the spread turns higher to validate the move.
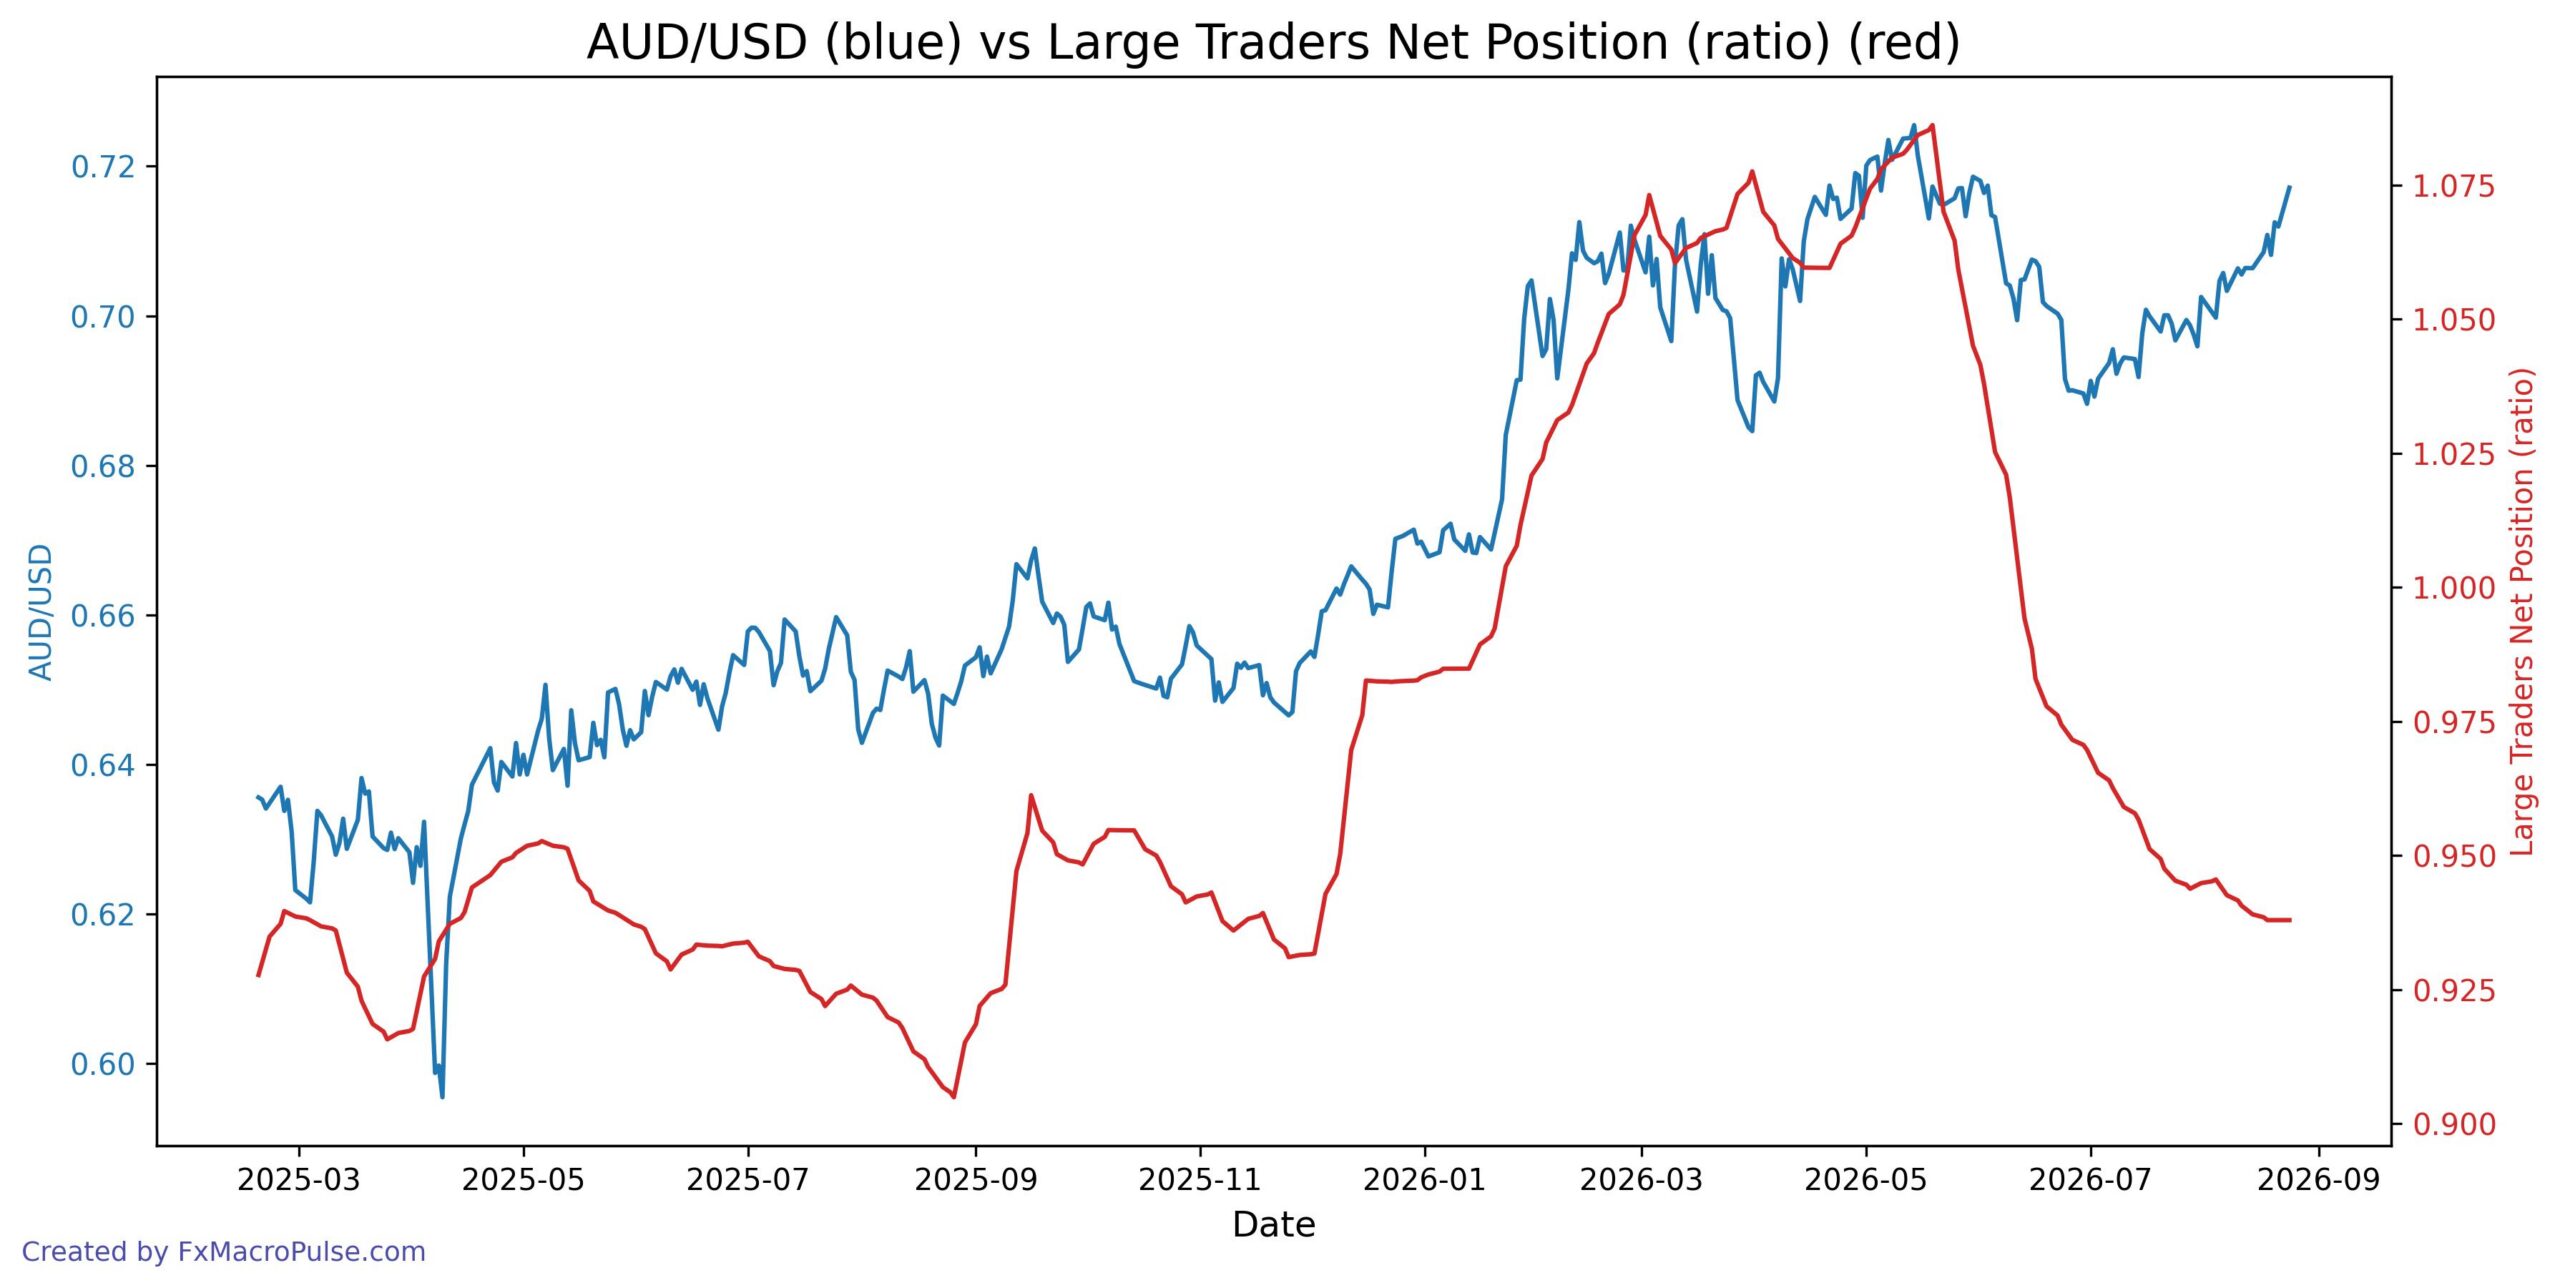
The AUD/USD daily chart shows price climbing from mid-2025 to fresh highs near 0.72 by August 2026, but the COT large trader net position ratio peaked at 1.077 in late March and then dropped to 0.938, creating a clear bearish divergence. This means price rises while large traders reduce their net long exposure, so the rally lacks strong speculative backing. On the daily and weekly timeframes, traders should note this weakening sentiment as a warning sign, especially since the ratio fell below 1.0 in June, hinting that institutional positioning no longer supports the uptrend.
News and Geopolitics
The Australian dollar remains firmly bearish as geopolitical pressures continue to dominate its outlook, with US tariff policy, the risk of Middle East energy supply disruptions, and accelerating US-China decoupling weighing heavily on the pair. While the recent push for a domestic critical minerals reserve offers some potential medium-term support, it is unlikely to counterbalance the near-term headwinds. Given the fluid nature of trade negotiations and the unpredictable trajectory of regional conflicts, the situation carries significant uncertainty, leaving room for sharp reversals if any of these primary risk factors ease unexpectedly.