Macro Analysis
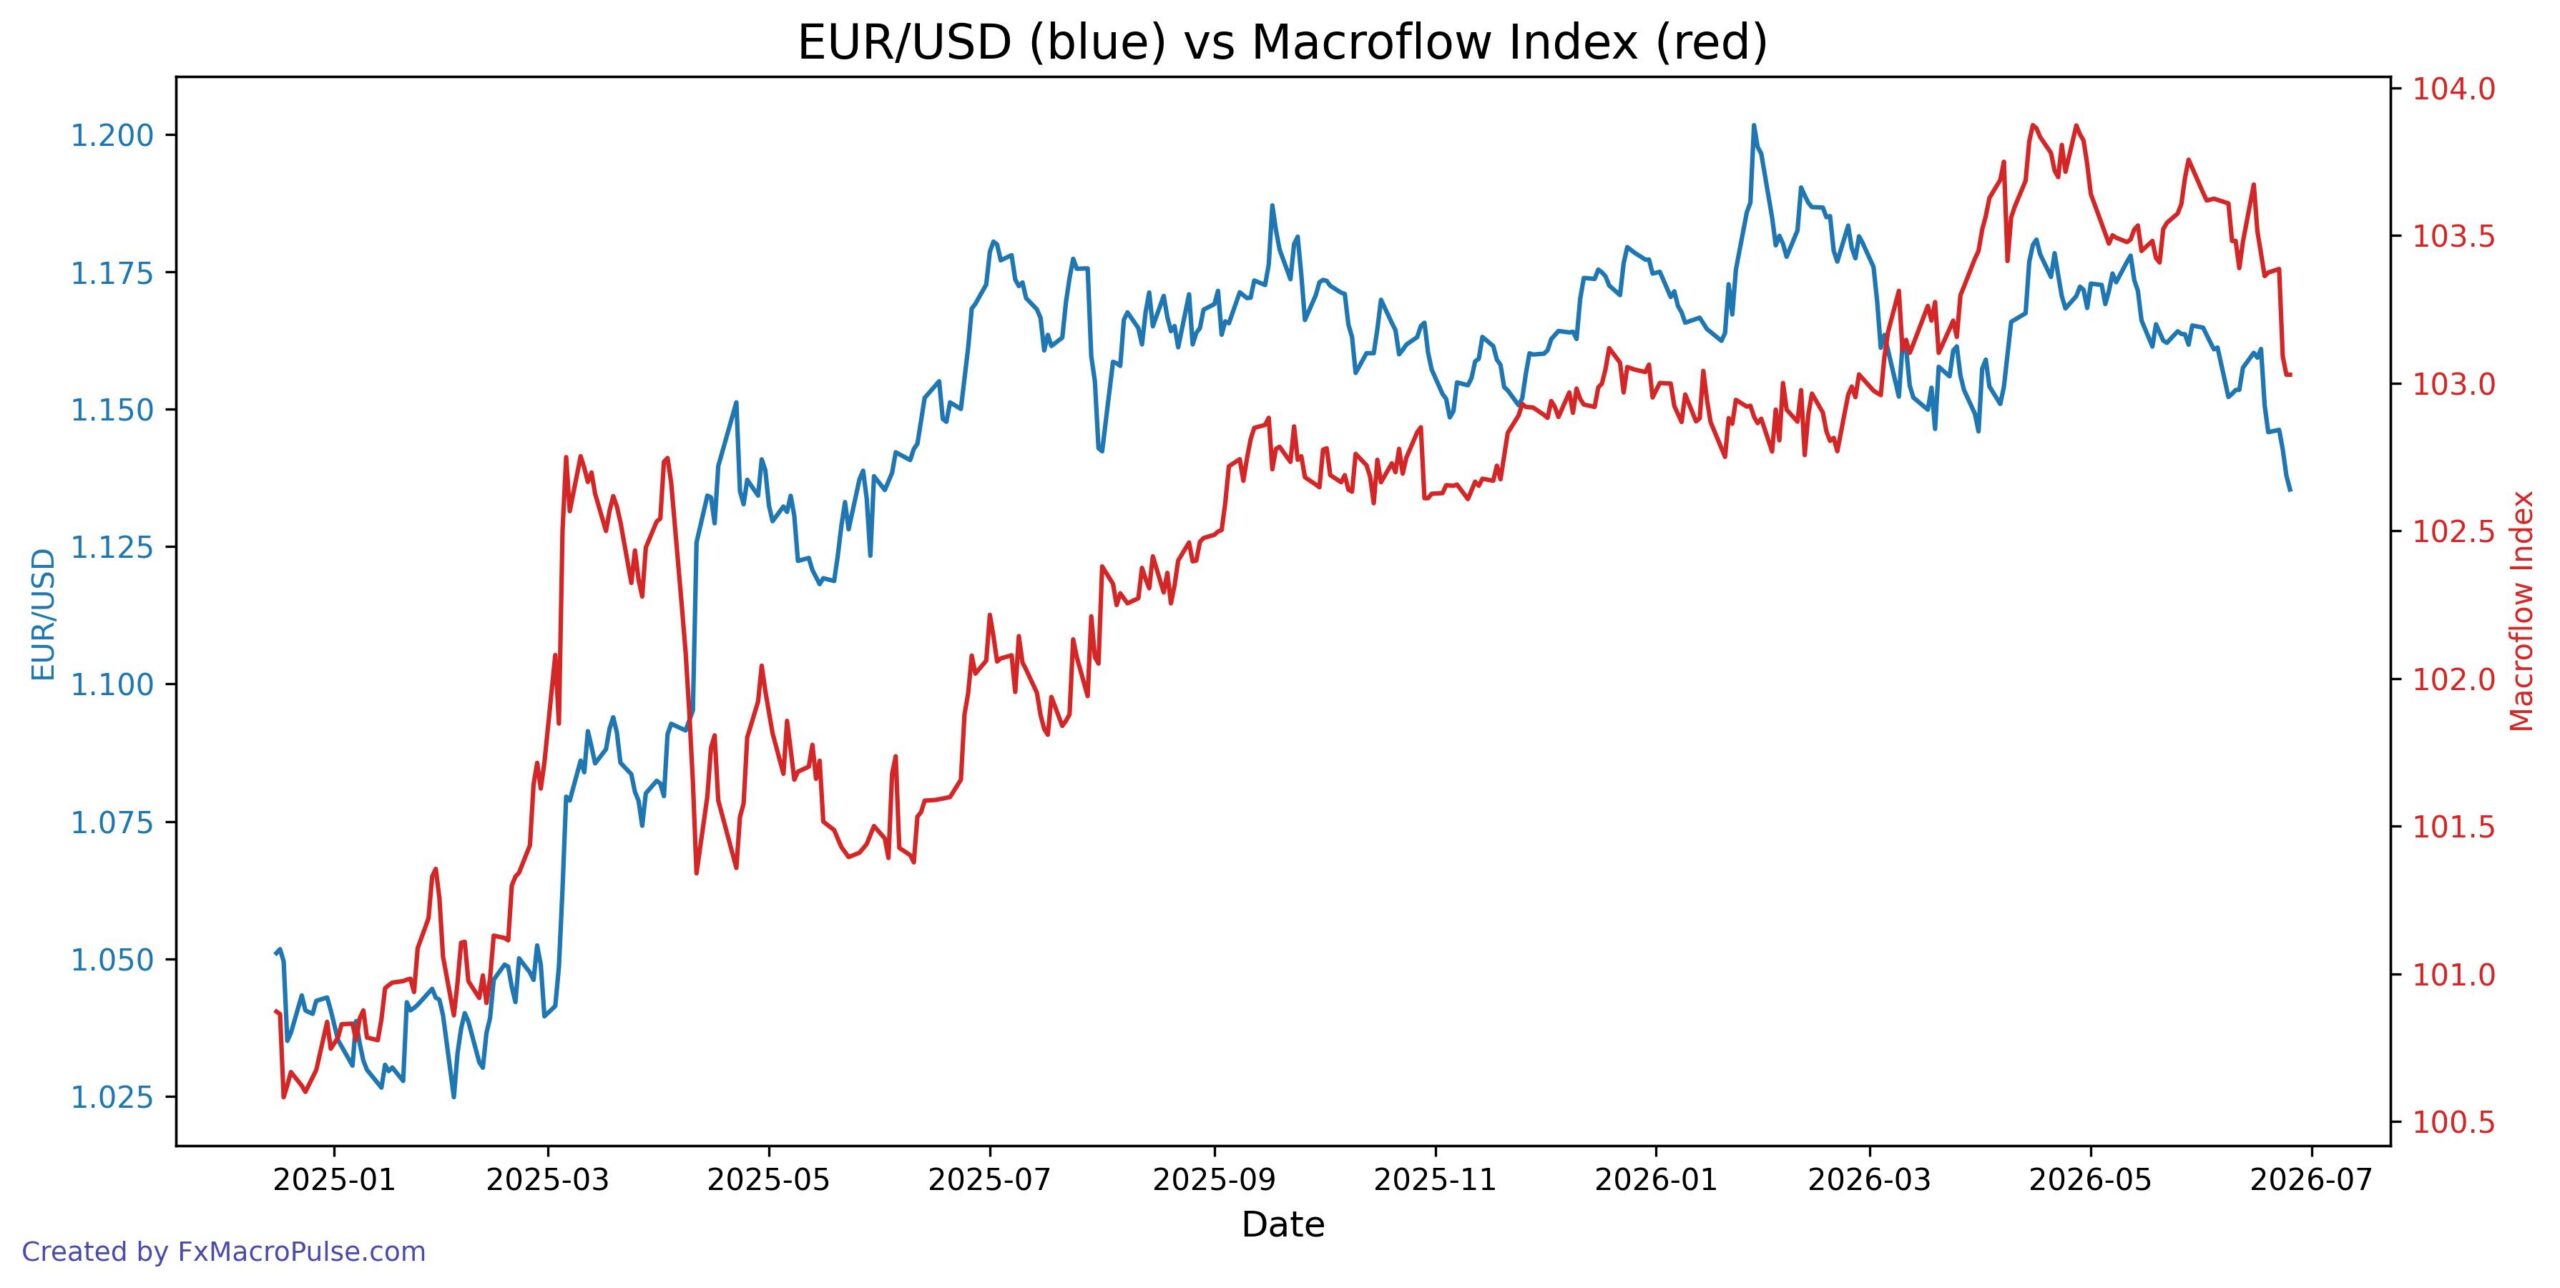
From December 2024 to June 2026, EUR/USD shows a moderate positive correlation (0.52) with the MacroFlow Index. Both moved broadly higher from early 2025 into early 2026, then turned lower. Lately, both are declining, but a subtle divergence appears: the MacroFlow Index flattened around 103.03 from June 24–25, while EUR/USD continued dropping from 1.13795 to 1.13542. This means EUR/USD weakened more than the index suggests, hinting at extra bearish pressure beyond the combined effects of yield spreads and gold.
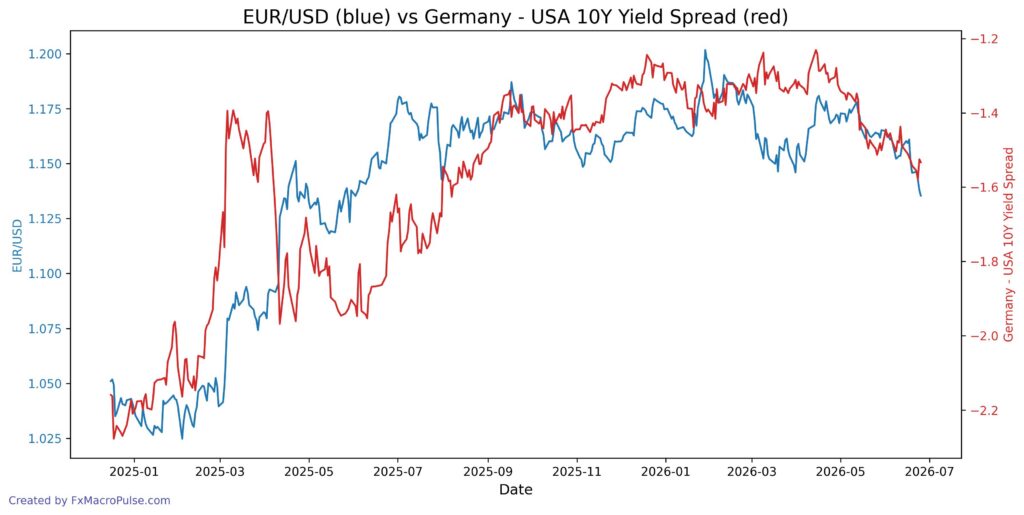
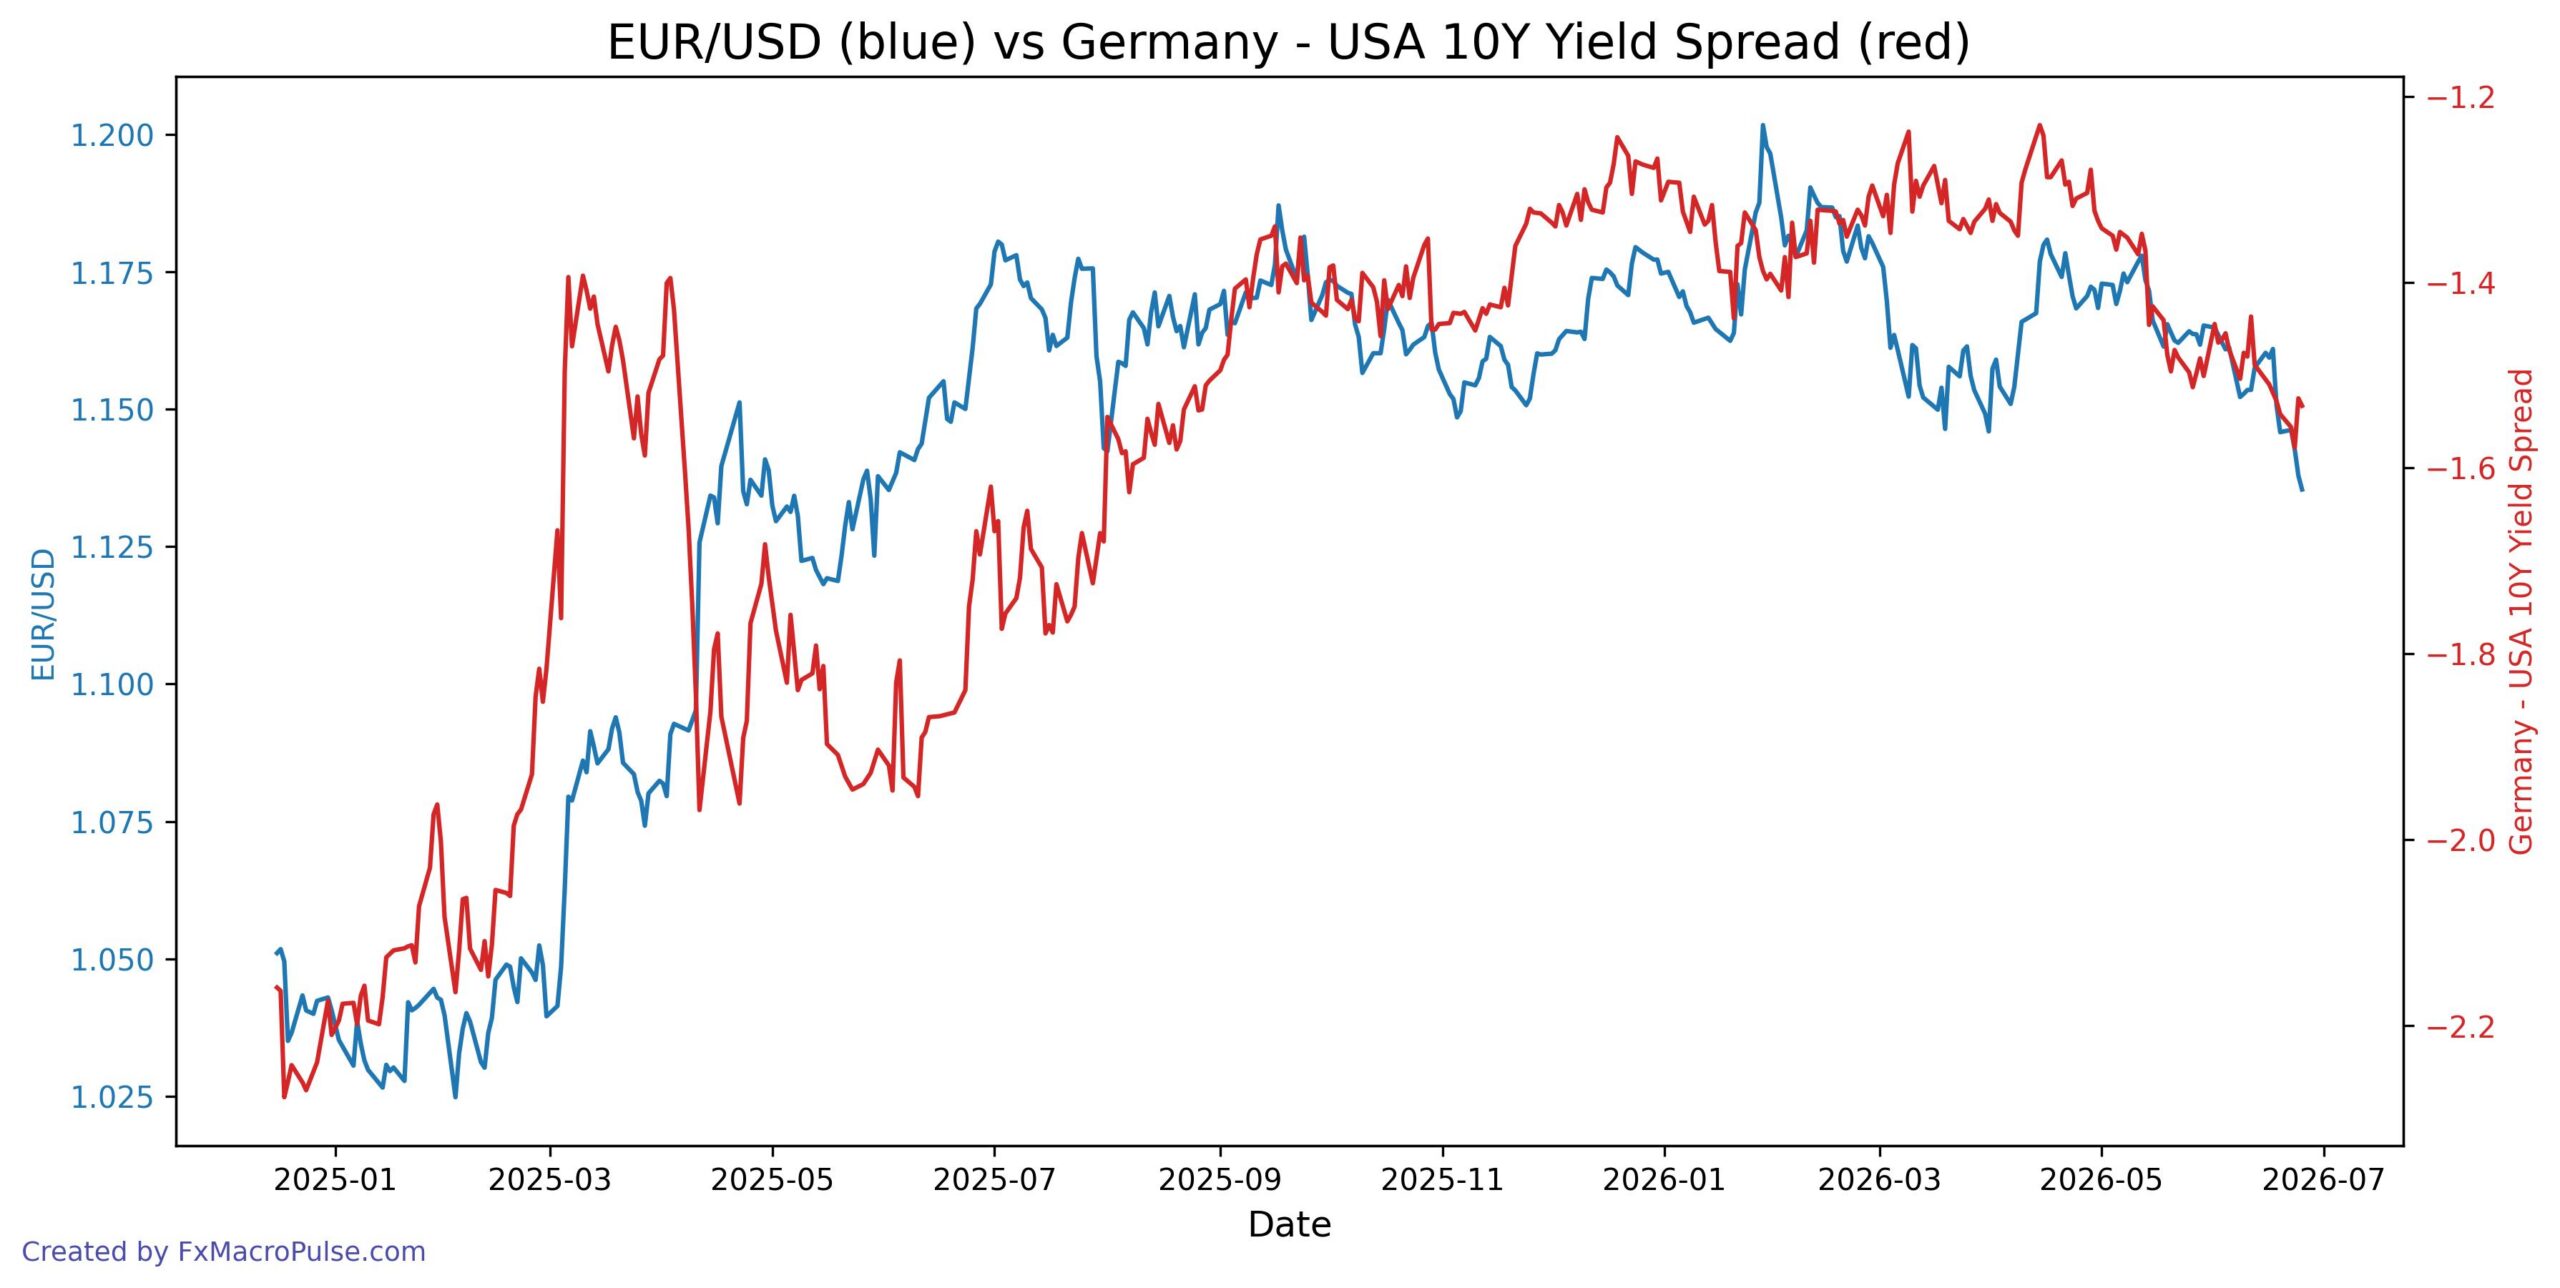
The yield spread (eur_10y_m_usd_10y) has narrowed from -1.578 on June 23 to -1.533 on June 25 – a less negative spread that typically supports the euro. Yet EUR/USD fell anyway. This points to other factors, like safe-haven demand for the dollar or weaker gold (the other component in the MacroFlow Index). The upcoming U.S. consumer sentiment revision (forecast 50.0, up from 48.9) may strengthen the dollar further, adding downside risk for the pair.
On the daily chart, EUR/USD broke below the 1.14 support zone and now eyes the 1.13 area. The weekly trend remains bearish since the January 2026 high near 1.20. The MacroFlow Index, while still above its February 2026 low near 102.7, is rolling over from its April peak around 103.8.
For traders: watch for a potential re-convergence if the MacroFlow Index catches down to EUR/USD, or for a bounce if the index stabilizes first. The positive correlation means moves in the yield spread or gold can reinforce EUR/USD direction. Currently, the divergence warns that EUR/USD may have further room to fall unless the index reverses.
COT Analysis
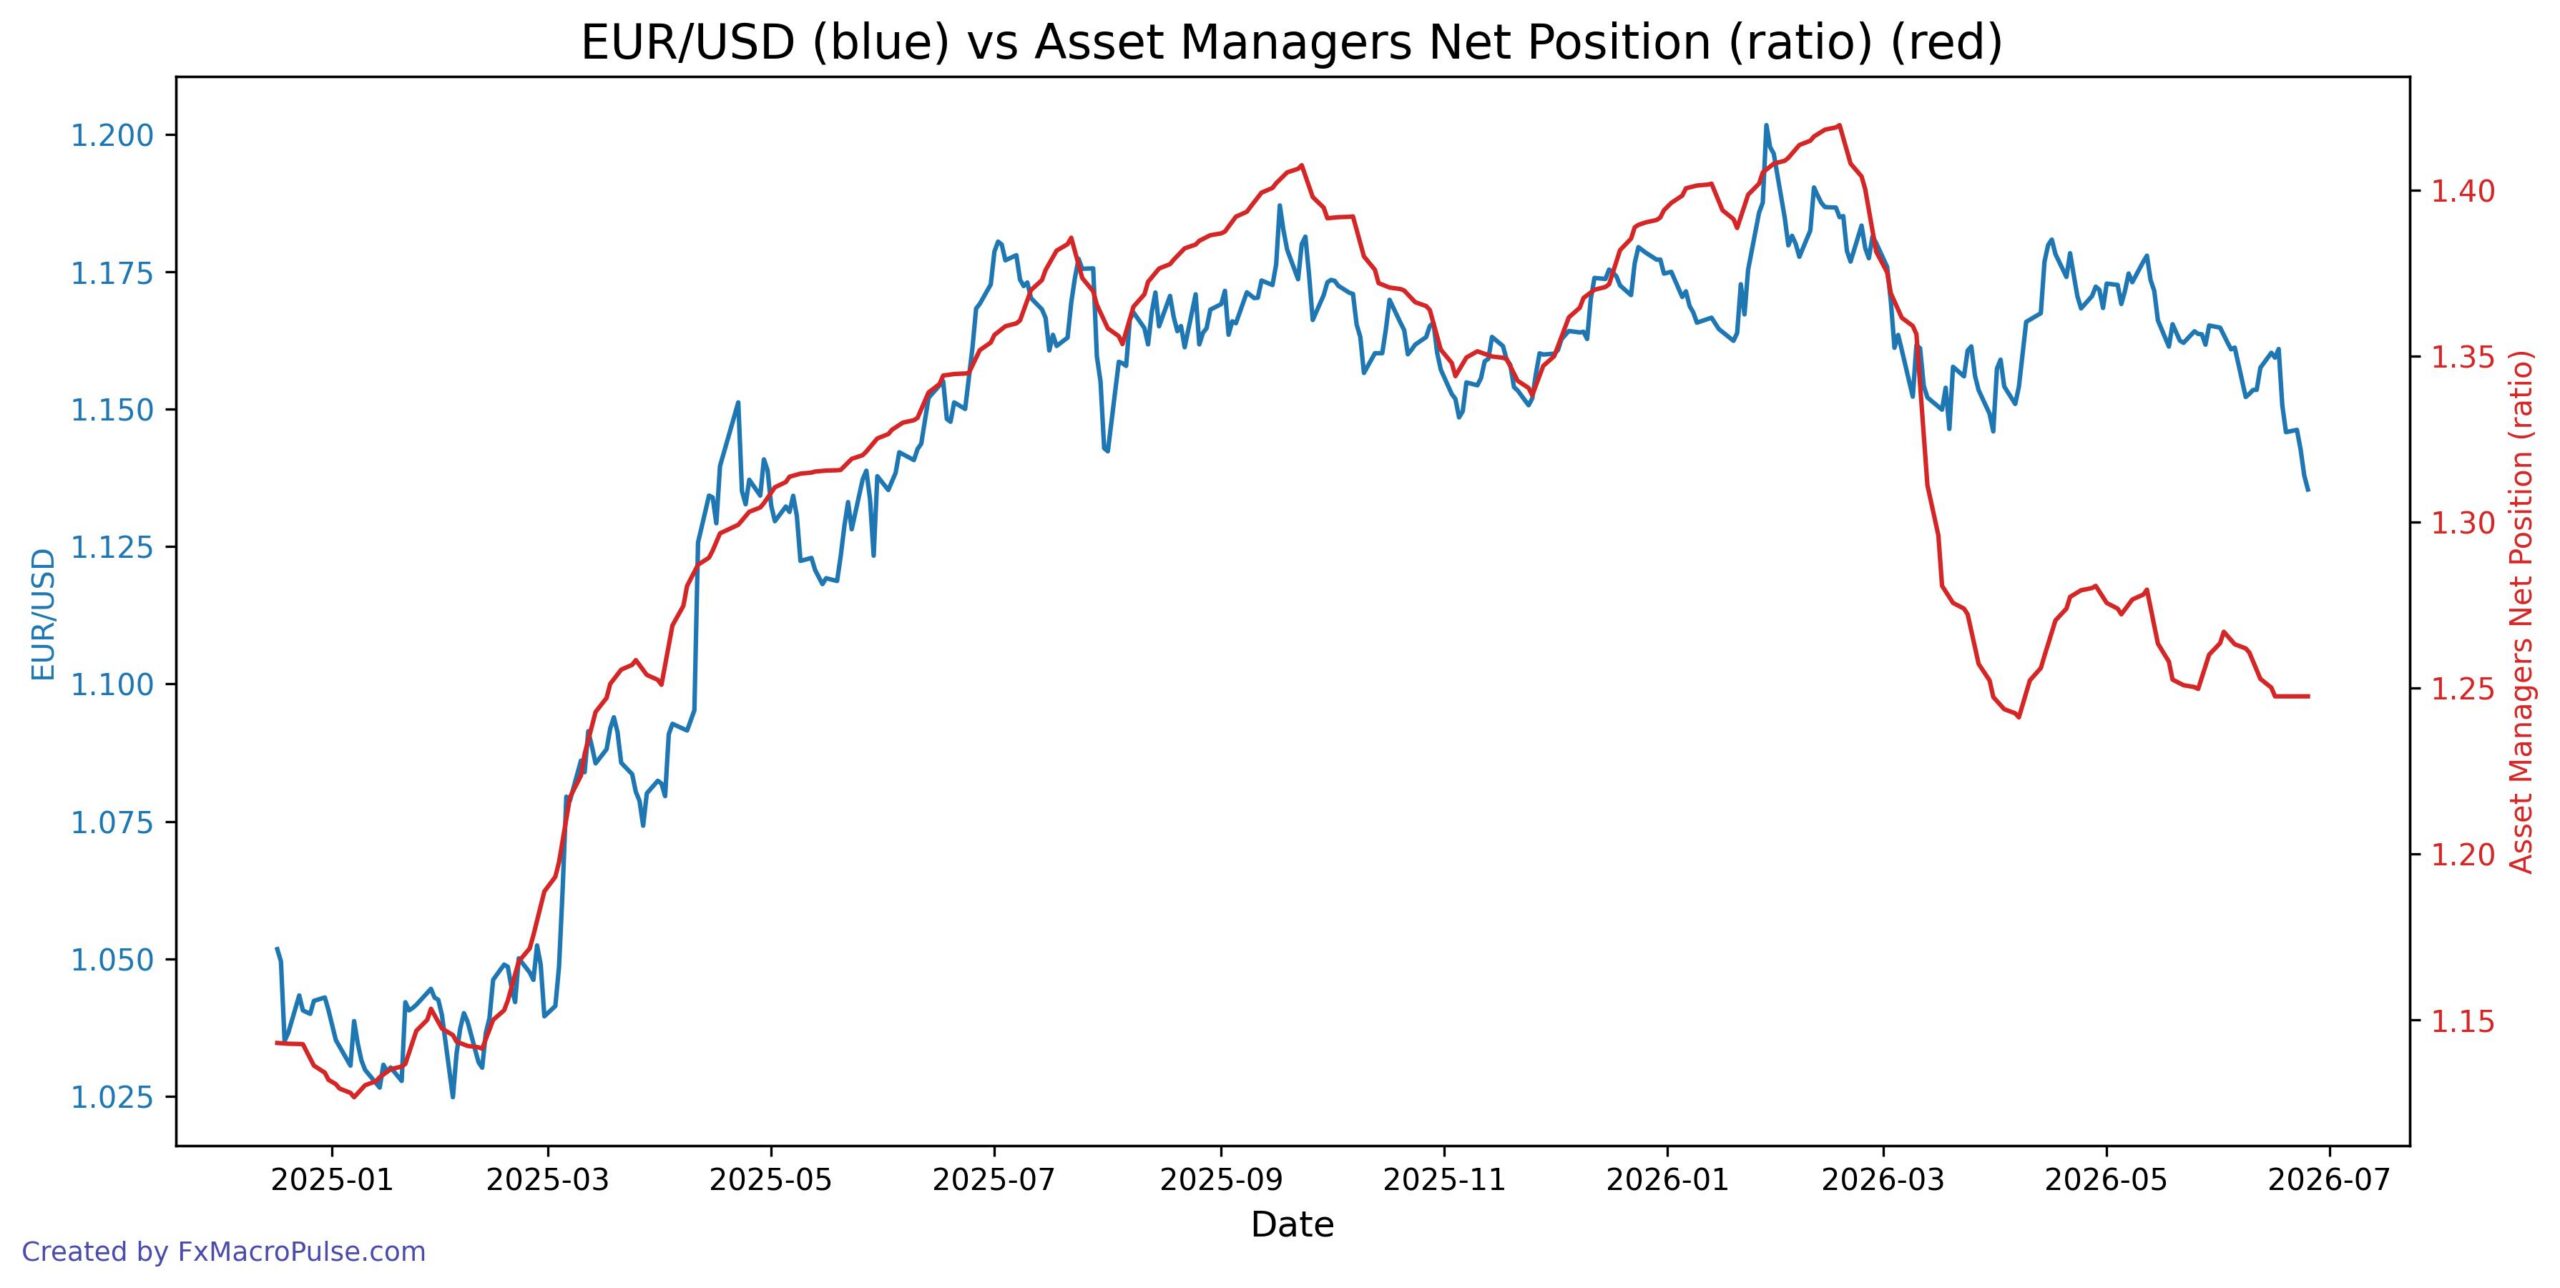
EUR/USD shows a clear bearish trend on the daily timeframe, dropping from 1.18 in late April to 1.135 in late June 2026. The Asset Managers Net Position ratio steadily fell from 1.41 to 1.247 over the same period, confirming a reduction in bullish sentiment and signaling convergence between price and speculative positioning. This alignment suggests persistent selling pressure with no divergence to warn of a reversal in the near term.
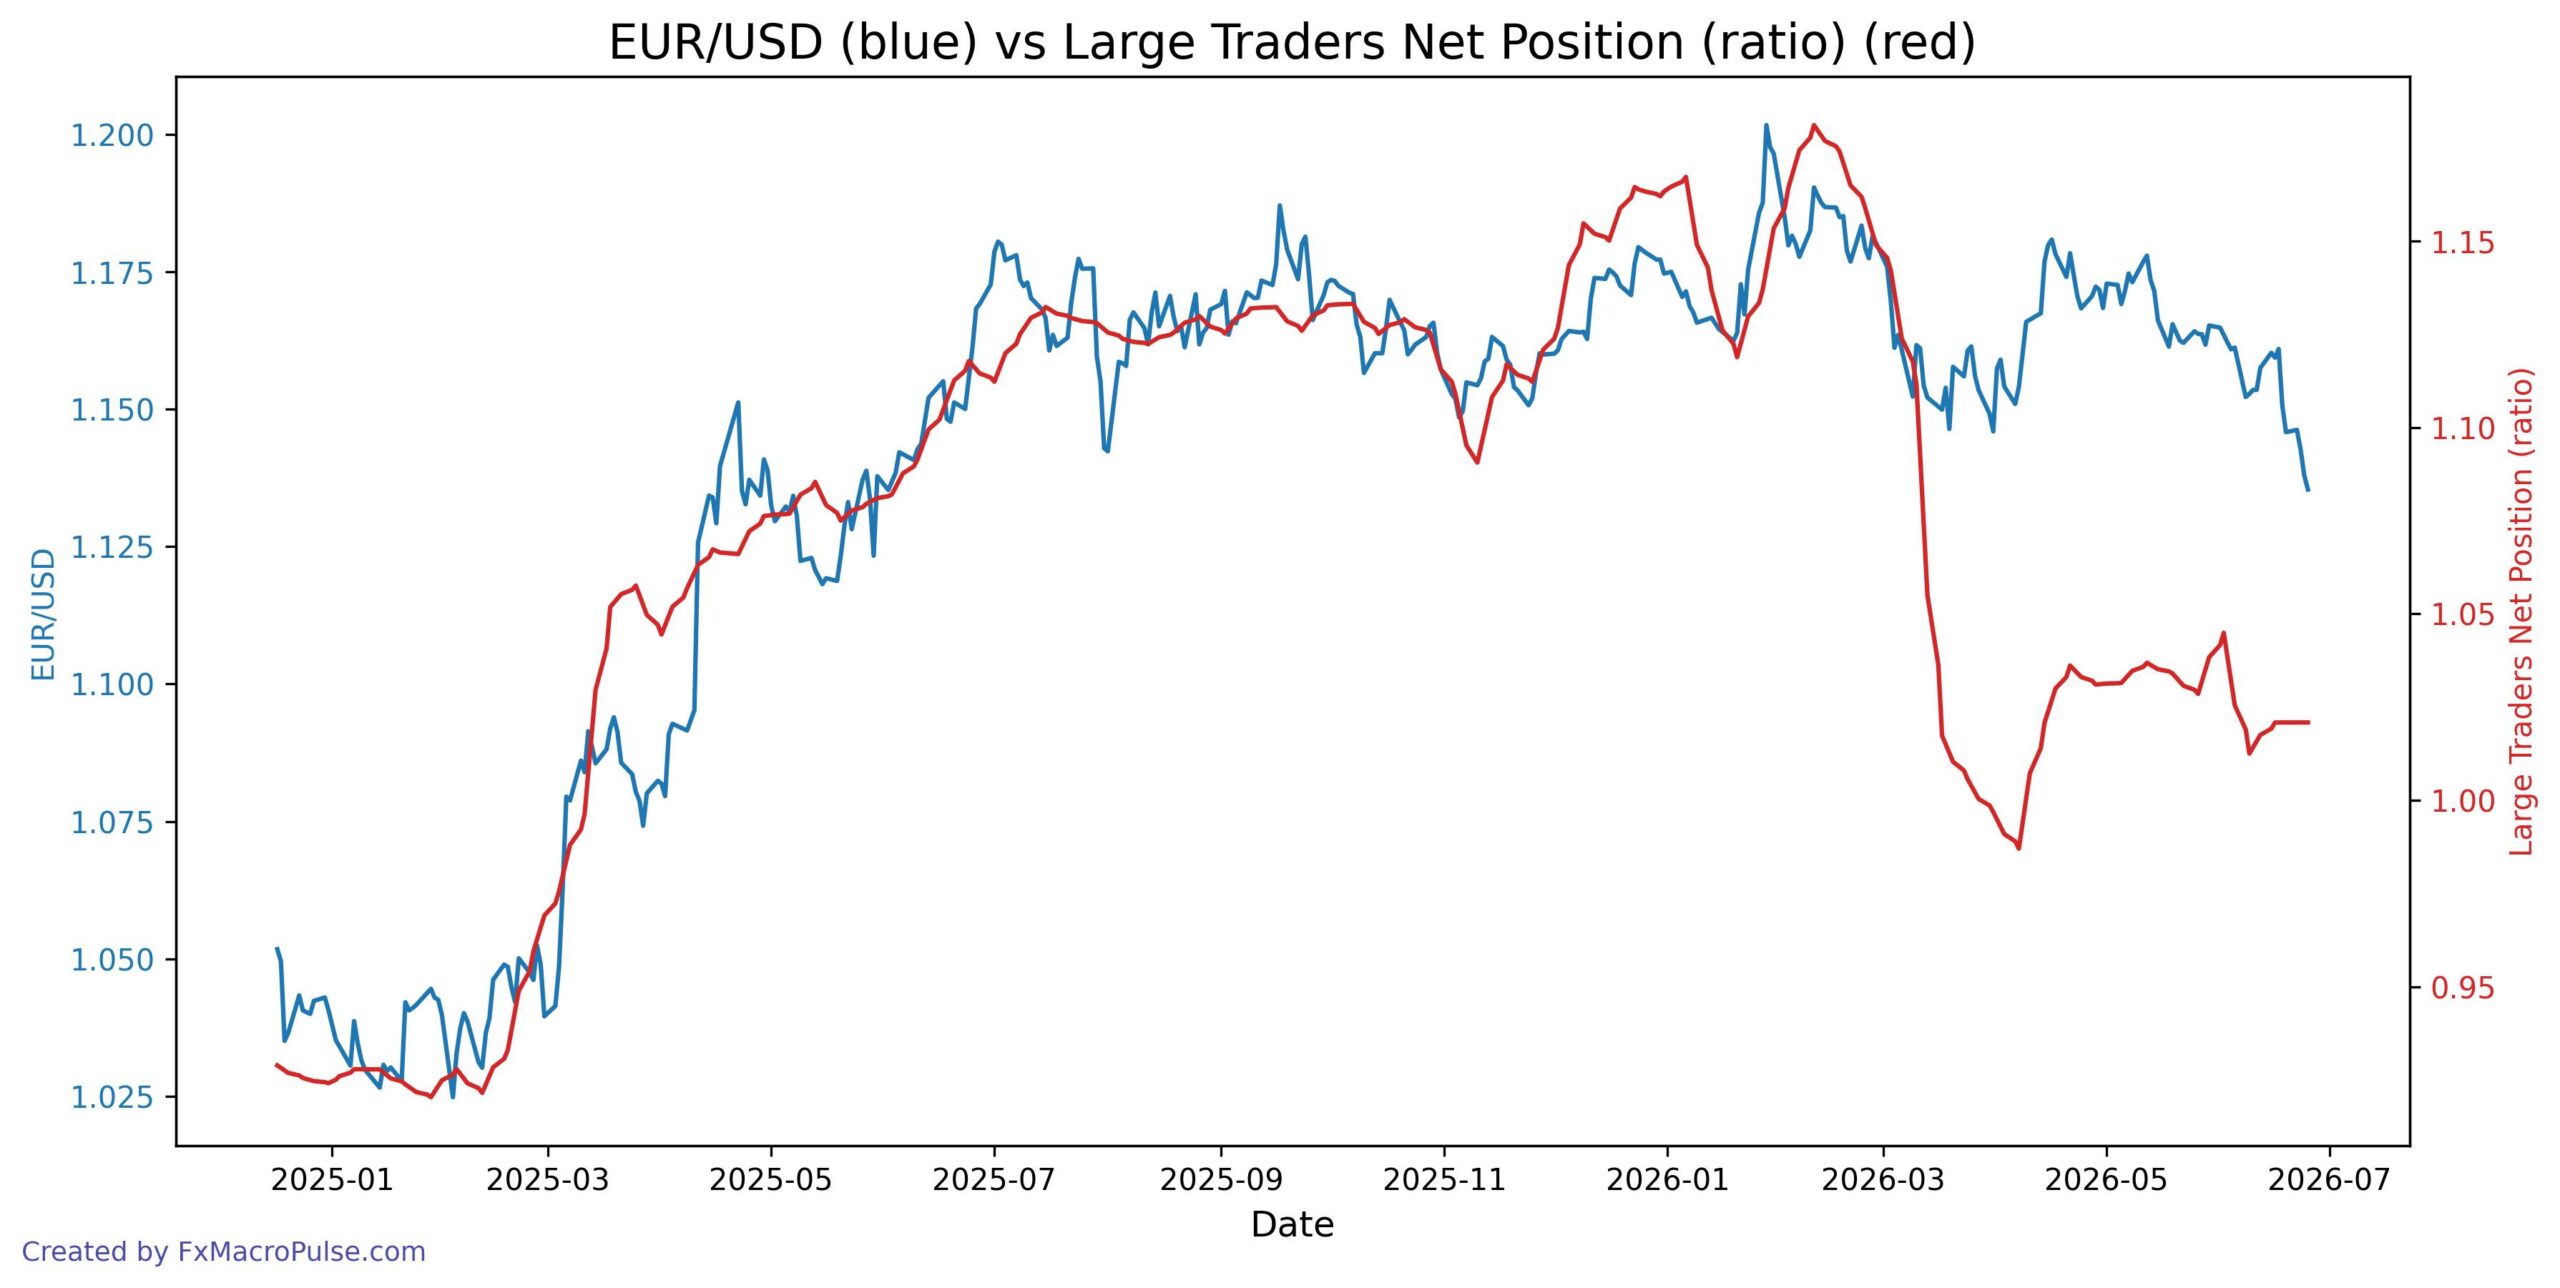
The EUR/USD price and the Large vs Commercial net position ratio display clear convergence since early 2026. Both have declined from their January highs, with the ratio falling sharply from +0.38 to near +0.07 while the pair dropped from 1.20 to the 1.14 area. This alignment suggests persistent bearish sentiment from speculators, reinforcing the recent downward drift in price. However, the price action remains range-bound, so the convergence is gradual rather than explosive.
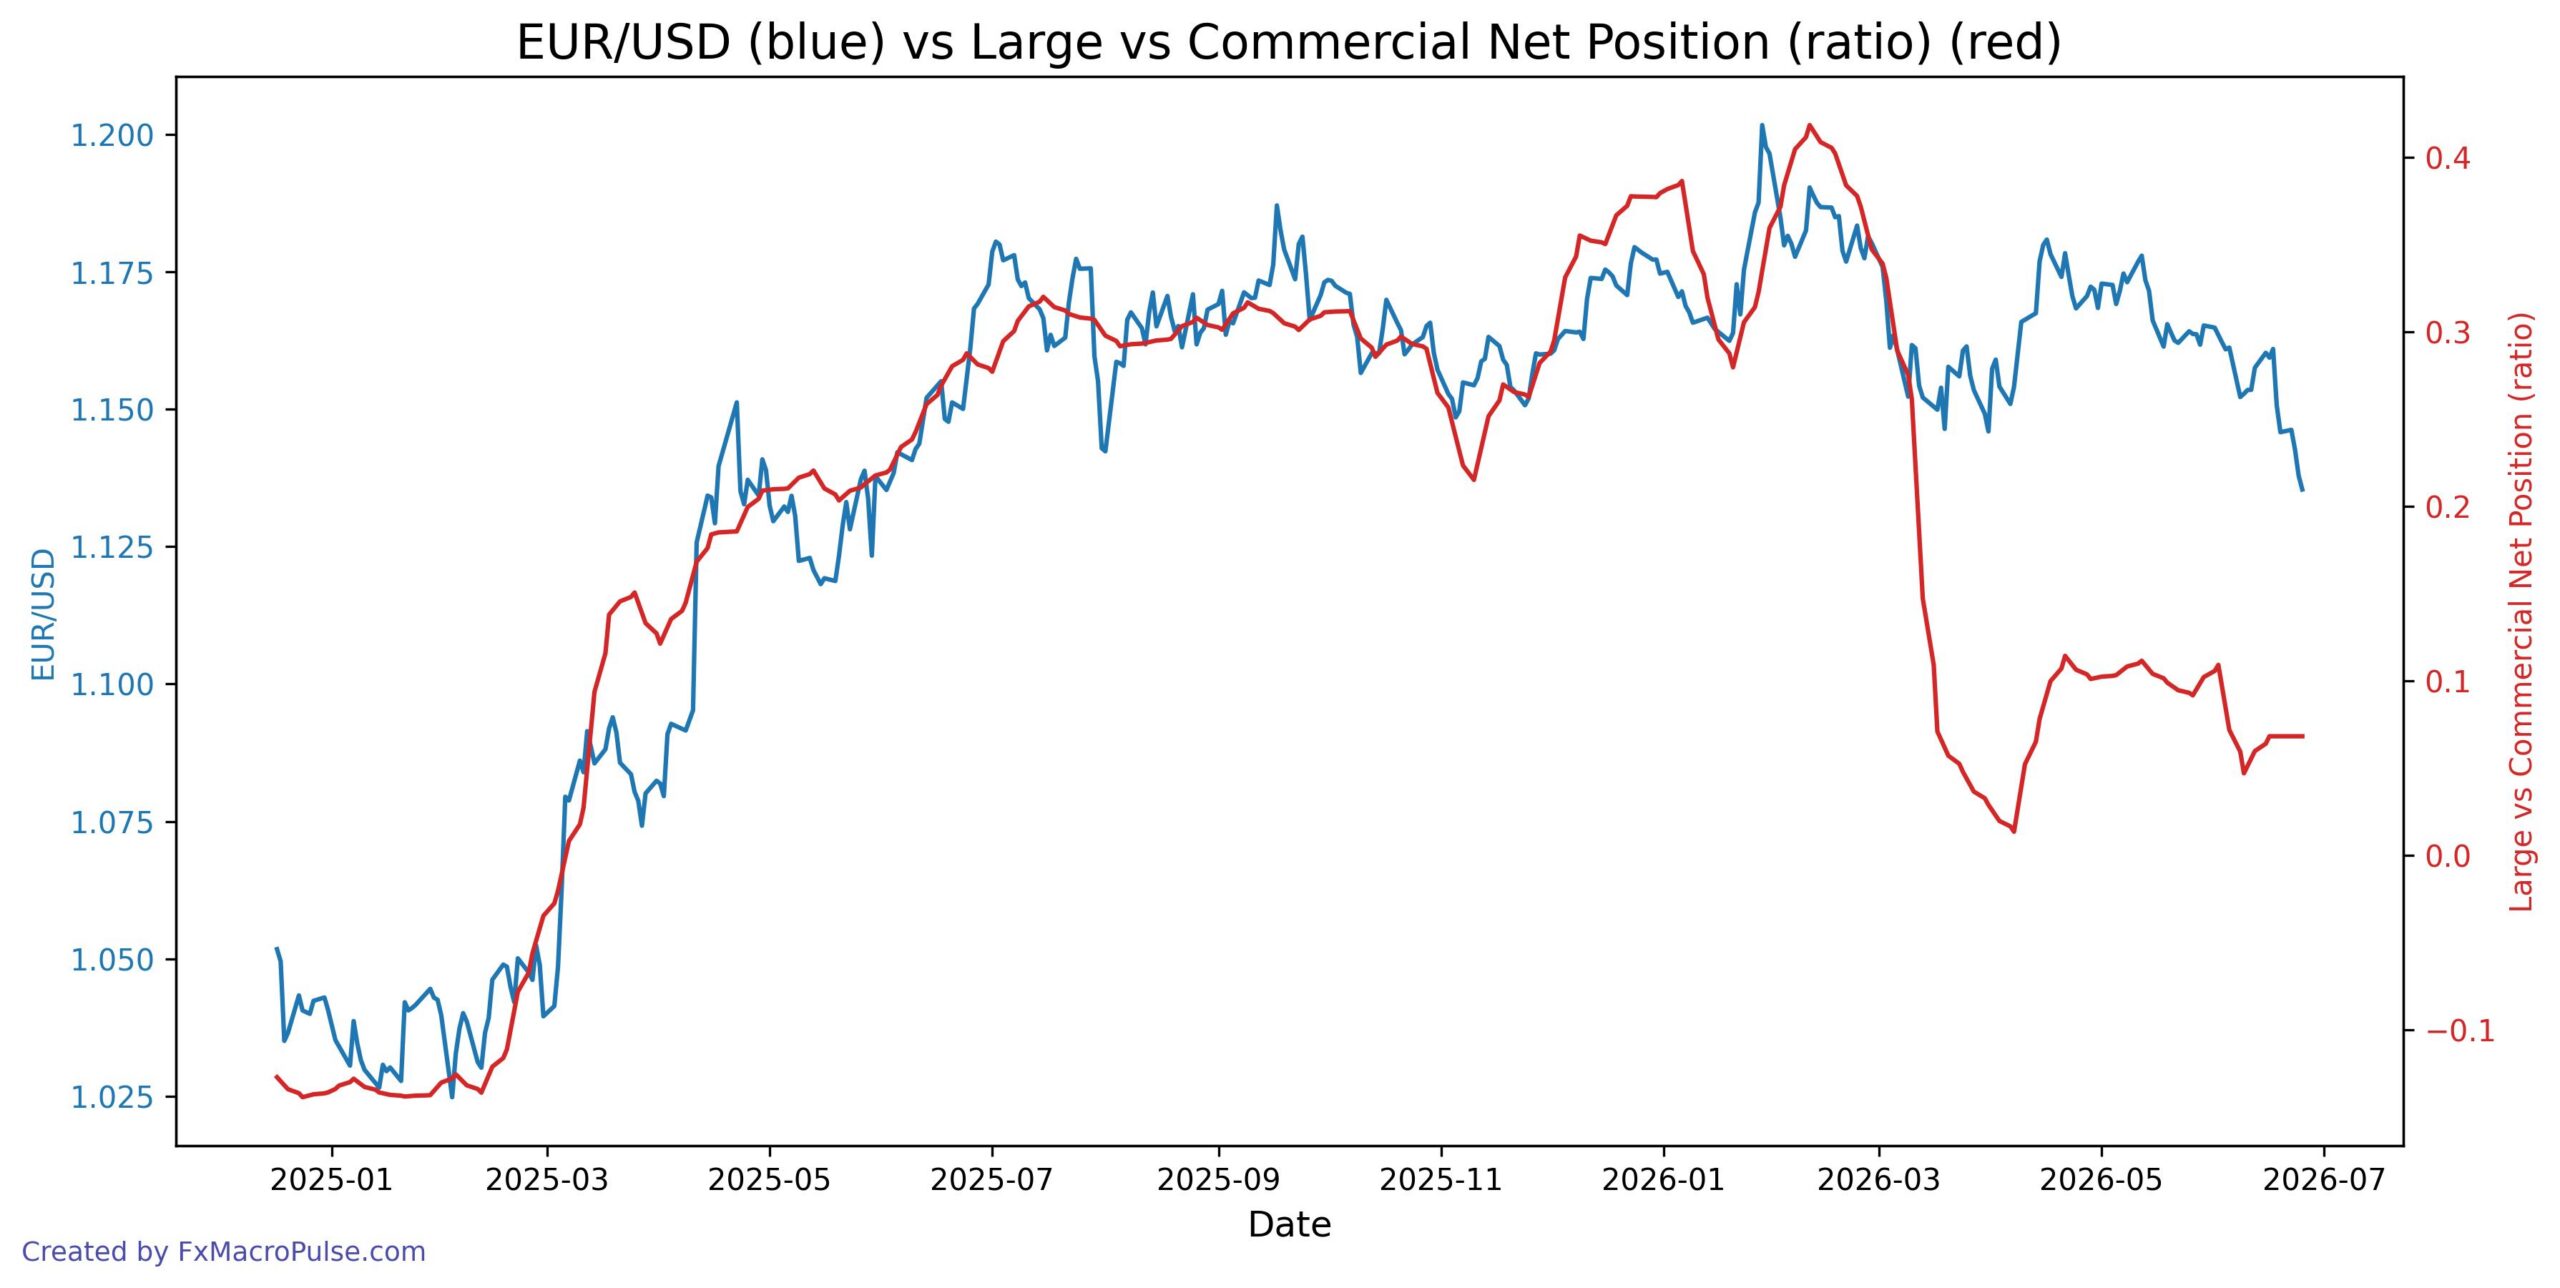
From the data, EUR/USD rallied strongly from early 2025 to January 2026, with the COT ratio rising in tandem – a clear convergent bullish signal. However, after price peaked near 1.20, the COT ratio continued to climb to an extreme, creating a divergence that preceded the sharp selloff since March 2026. Since then, both price and the COT ratio have fallen together, confirming bearish sentiment. Traders should watch for further convergence to the downside on daily and weekly timeframes.